Fig. 8.
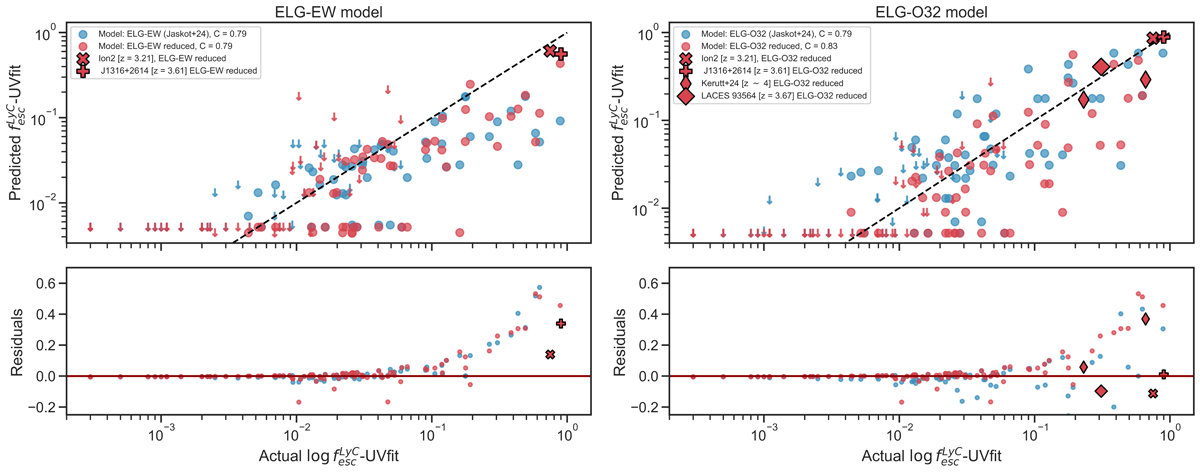
Download original image
Detected (or upper limit) fesc values versus the predicted fesc values ftom Cox models, calibrated using the full LzLCS+ sample and the subsample of galaxies resembling reionization-era sources. Left panel: Predictions using the ELG-EW model. Right panel: Predictions using the ELG-O32 model. The Cox models from Jaskot et al. 2024b are shown in blue, while predictions calibrated on the subsample are in red. Predictions applied to known LyC leakers at z ∼ 3 are also shown in red Vanzella et al. 2015, 2016; de Barros et al. 2016; Marques-Chaves et al. 2022; Fletcher et al. 2019; Kerutt et al. 2024. Upper limits are indicated with downward-pointing arrows.
Current usage metrics show cumulative count of Article Views (full-text article views including HTML views, PDF and ePub downloads, according to the available data) and Abstracts Views on Vision4Press platform.
Data correspond to usage on the plateform after 2015. The current usage metrics is available 48-96 hours after online publication and is updated daily on week days.
Initial download of the metrics may take a while.