Fig. 10.
Download original image
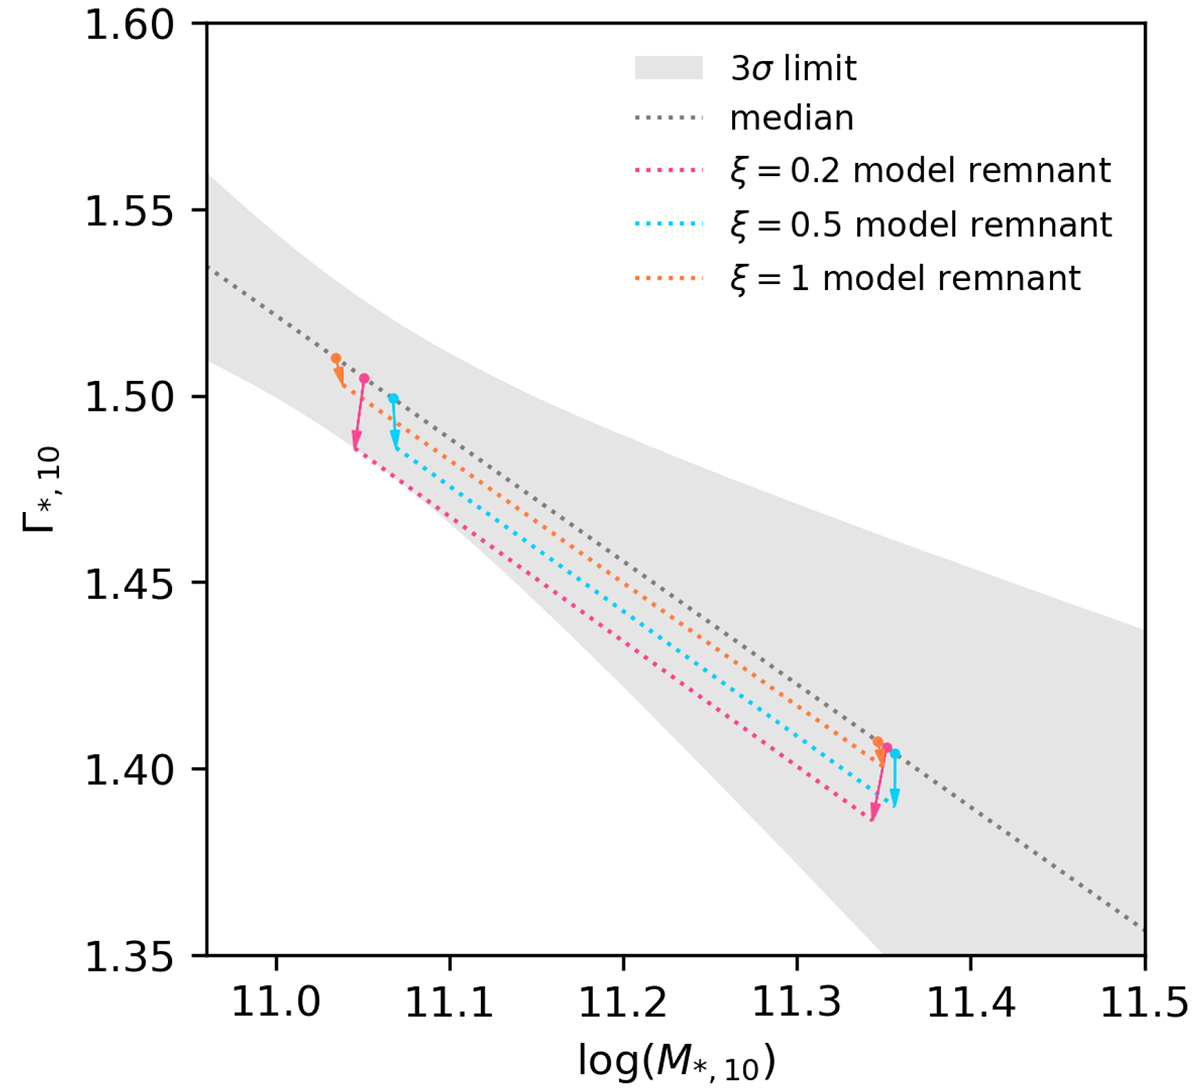
Evolution of the Γ*, 10 − M*, 10 relation due to different merger toy models. As in Fig. 5, the gray band represents an upper limit of the evolution of the Γ*, 10 − M*, 10 relation. The median Γ*, 10 − M*, 10 relation of the gray band (shown as a dashed, gray line) serves as a starting point. The fitting formula of EMERGE (Moster et al. 2018) is used to estimate the number of mergers, thus calculating ζμ and ζβ. The three sets of dots that lie on the starting Γ*, 10 − M*, 10 relation represent three different merger models, while the arrows show the change of these dots and the resulting Γ*, 10 − M*, 10 relation.
Current usage metrics show cumulative count of Article Views (full-text article views including HTML views, PDF and ePub downloads, according to the available data) and Abstracts Views on Vision4Press platform.
Data correspond to usage on the plateform after 2015. The current usage metrics is available 48-96 hours after online publication and is updated daily on week days.
Initial download of the metrics may take a while.