Fig. 11.
Download original image
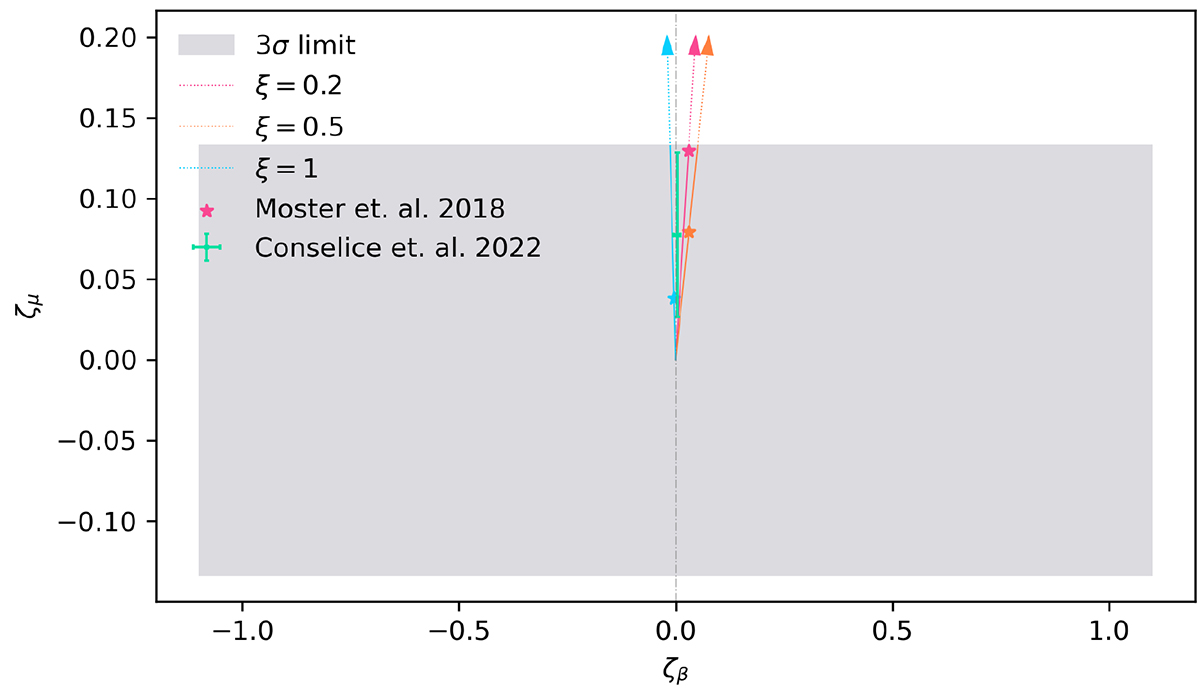
Upper limit of Γ*, 10 − M*, 10 relation evolution in ζμ − ζβ space. The filled gray contour represents the estimate of the allowed evolution in the slope and normalization of the Γ*, 10 − M*, 10 relation. The star symbol indicates the prediction of ξ = 0.2 (in pink), ξ = 0.5 (in orange), and ξ = 1 (in blue) mergers, with merger numbers obtained from Moster et al. (2018). The arrows indicate the direction in which ζμ and ζβ would evolve if the number of merger events increases. We also include mass growth estimates, specifically ![]() and
and ![]() , from Conselice et al. (2022). The combined evolution of Γ*, 10 − M*, 10 relation from both major and minor mergers is shown with a green error bar.
, from Conselice et al. (2022). The combined evolution of Γ*, 10 − M*, 10 relation from both major and minor mergers is shown with a green error bar.
Current usage metrics show cumulative count of Article Views (full-text article views including HTML views, PDF and ePub downloads, according to the available data) and Abstracts Views on Vision4Press platform.
Data correspond to usage on the plateform after 2015. The current usage metrics is available 48-96 hours after online publication and is updated daily on week days.
Initial download of the metrics may take a while.