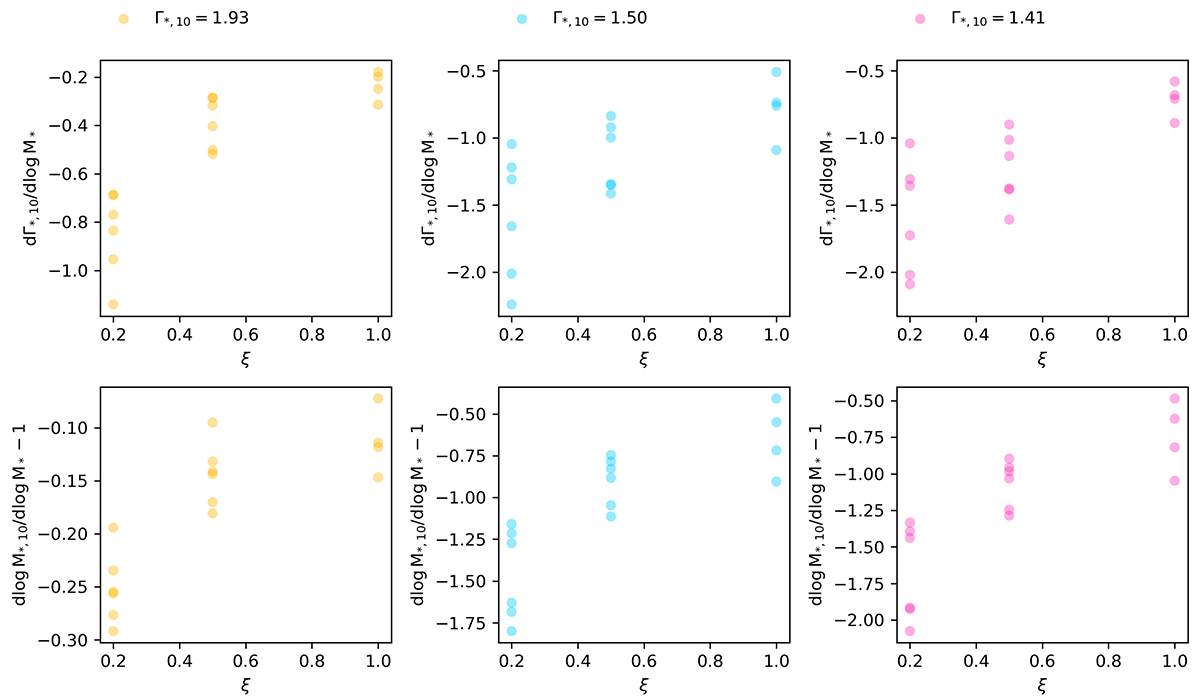
Fig. 8.
Download original image
Derivatives of log M*, 10 and Γ*, 10 with respect to log M* for three differently sized ETGs due to mergers. The first row shows the log M* derivative of Γ*, 10 for each merger mass ratio, ξ. The three columns correspond to different sets of mock galaxies with varying Γ*, 10. The second row shows the log M* derivative of log M*, 10, offset by one to remove the effect of homogeneous mass accretion. Each data point represents a particular run of simulations. For ξ = 1, two sets of simulations with two runs in each set are shown. For the other two values of ξ, three sets of simulations are shown. Note that in some cases two point overlap, hence the number of visible data points is smaller than the number of runs.
Current usage metrics show cumulative count of Article Views (full-text article views including HTML views, PDF and ePub downloads, according to the available data) and Abstracts Views on Vision4Press platform.
Data correspond to usage on the plateform after 2015. The current usage metrics is available 48-96 hours after online publication and is updated daily on week days.
Initial download of the metrics may take a while.