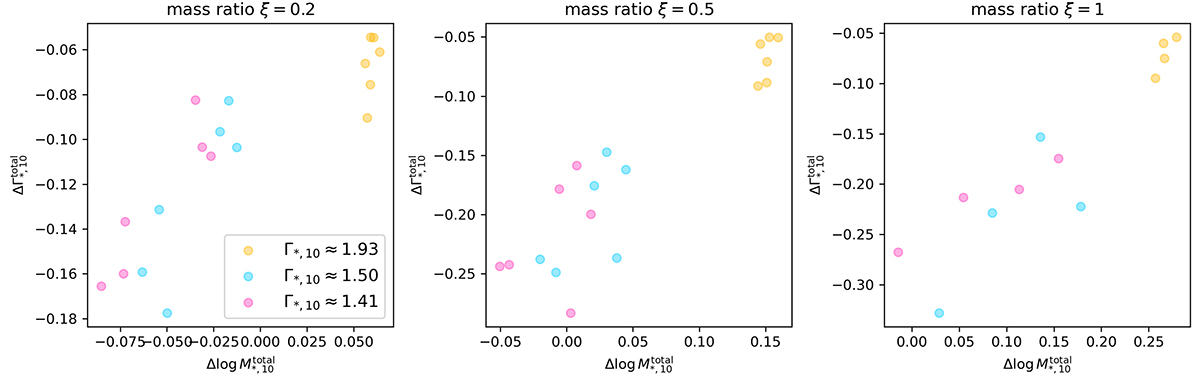
Fig. 9.
Download original image
Three panels illustrating changes in log M*, 10 and Γ*, 10 induced by mergers. Different colors represent distinct Γ*, 10 values of the main galaxy. Each data point corresponds to a particular run of simulations. For merger mass ratio ξ = 1, two sets of simulations with two runs in each set are shown. For the other two values of ξ, three sets of simulations are shown. Some data points overlap, hence the number of visible data points is smaller than the number of runs.
Current usage metrics show cumulative count of Article Views (full-text article views including HTML views, PDF and ePub downloads, according to the available data) and Abstracts Views on Vision4Press platform.
Data correspond to usage on the plateform after 2015. The current usage metrics is available 48-96 hours after online publication and is updated daily on week days.
Initial download of the metrics may take a while.