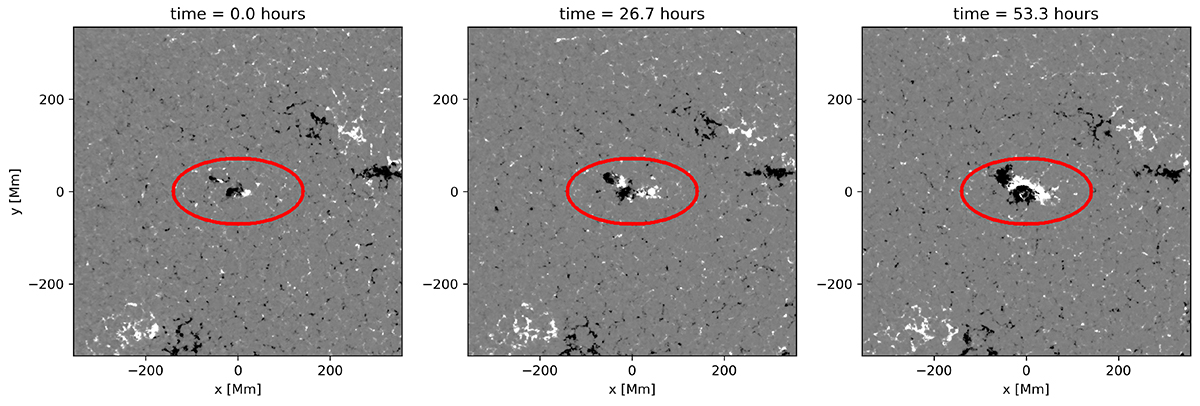
Fig. 1.
Download original image
Example of the highest flux active region from the Helioseismic Emerging Active Region Survey (Schunker et al. 2016). The line-of-sight magnetic field is shown at three times during the emergence process. The emergence time, t = 0, is defined as when 10% of the maximum (over the 36 hours after the active region was given a NOAA number) magnetic flux has emerged. The red curve outlines the area A we used for the analysis of this active region emergence.
Current usage metrics show cumulative count of Article Views (full-text article views including HTML views, PDF and ePub downloads, according to the available data) and Abstracts Views on Vision4Press platform.
Data correspond to usage on the plateform after 2015. The current usage metrics is available 48-96 hours after online publication and is updated daily on week days.
Initial download of the metrics may take a while.