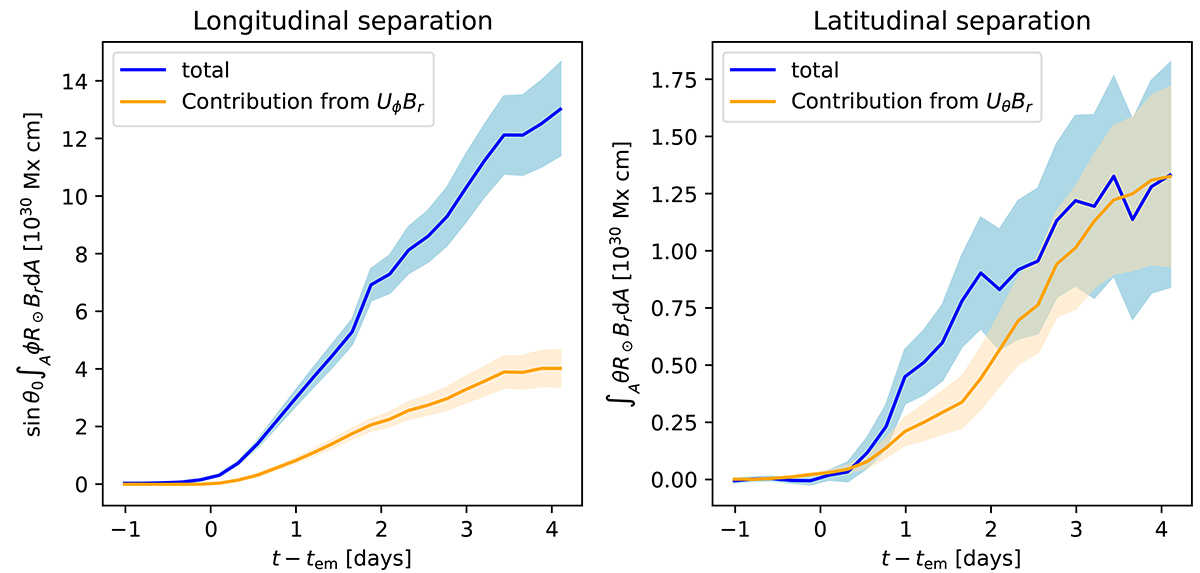
Fig. 2.
Download original image
Average evolution of the toroidal and poloidal magnetic field due to flux emergences in the HEARS (Schunker et al. 2016) sample. The blue curves show sin(θ0)∫Aϕ R⊙BrdA (left panel) and ∫Aθ R⊙BrdA (right panel), where θ0 is the emergence colatitude. The orange curves show the contributions coming from ∫T∫AUϕBrdA dt and ∫T∫AUθBrdA dt in the left and right panels, respectively. The shaded regions show the respective 1σ error ranges. The error of the total and the error of the contributions from the surface flows are correlated. The difference between the blue and orange curves includes the effect of the contributions from horizontal magnetic flux being carried radially outward by small-scale radial flows. This component is small in the right panel, indicating that the field is east-west aligned before emergence, and only gains a north-south component due to north-south surface motions during the emergence process.
Current usage metrics show cumulative count of Article Views (full-text article views including HTML views, PDF and ePub downloads, according to the available data) and Abstracts Views on Vision4Press platform.
Data correspond to usage on the plateform after 2015. The current usage metrics is available 48-96 hours after online publication and is updated daily on week days.
Initial download of the metrics may take a while.