Fig. 13
Download original image
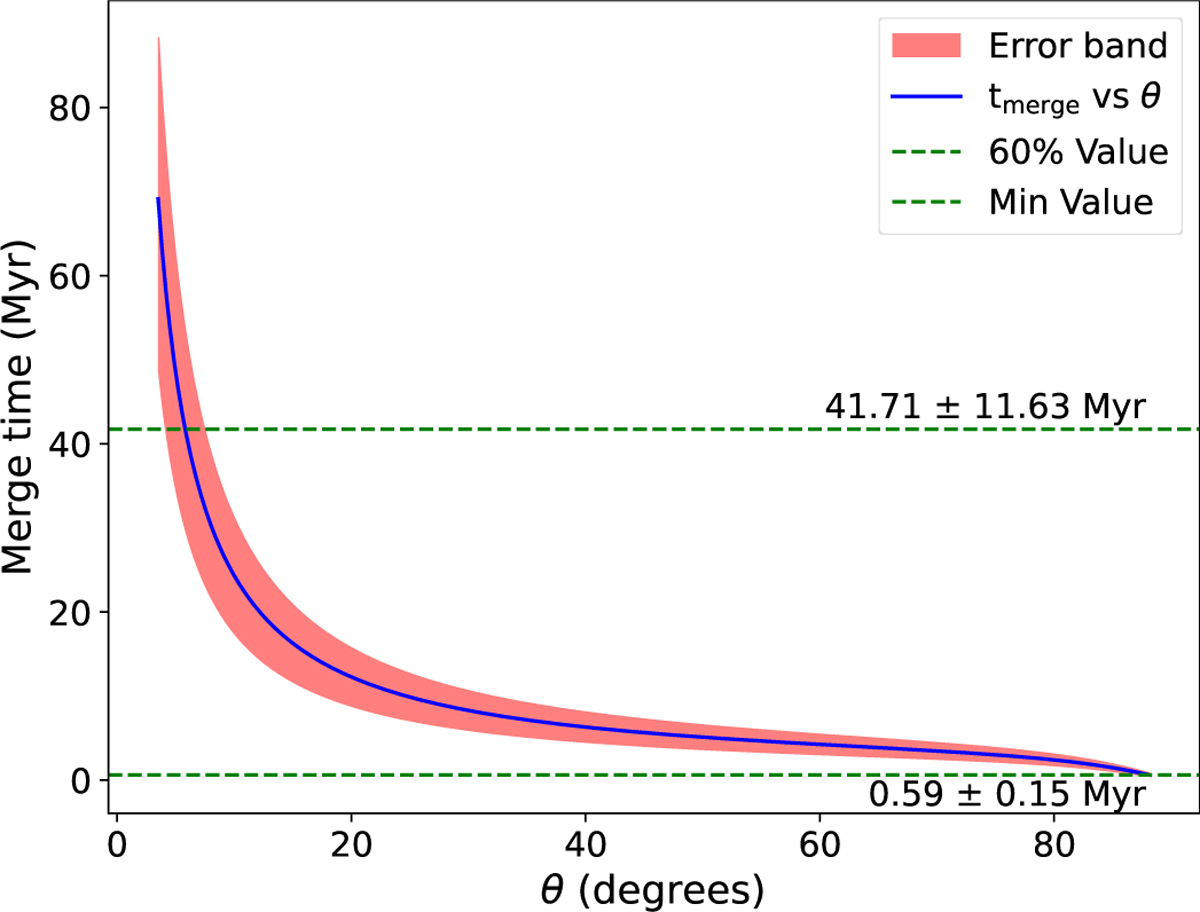
Function of tmerge as a function of θ (blue curve), where θ is the angle between vr and v, as shown in Fig. 6. The red area indicates the error band, and the horizontal green lines represent the minimum merger time corresponding to 60% value, which is obtained by sorting the merger times in ascending order and selecting the value at the 60% position between the minimum and maximum.
Current usage metrics show cumulative count of Article Views (full-text article views including HTML views, PDF and ePub downloads, according to the available data) and Abstracts Views on Vision4Press platform.
Data correspond to usage on the plateform after 2015. The current usage metrics is available 48-96 hours after online publication and is updated daily on week days.
Initial download of the metrics may take a while.