Fig. A.2
Download original image
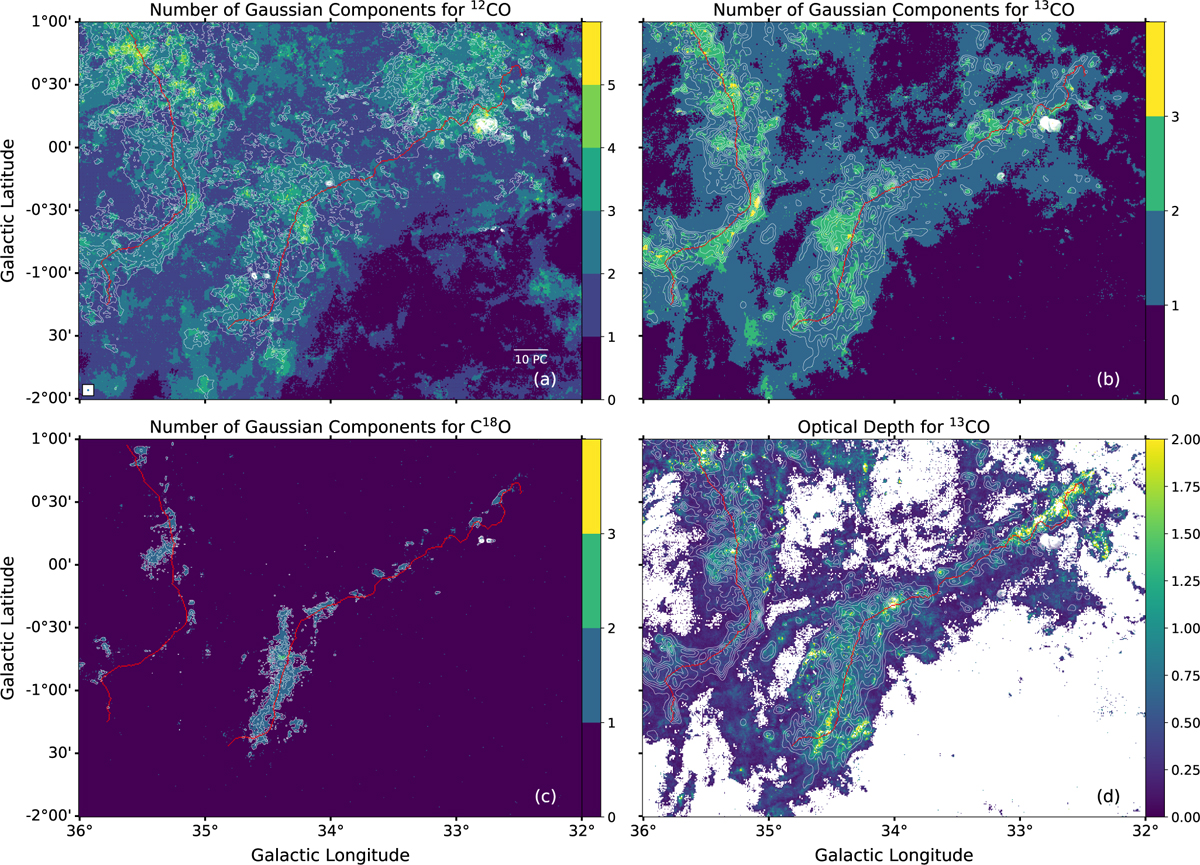
The red curves in the four panels represent the filament skeleton. (a) The background shows the number of Gaussian components of the 12CO spectra, with contours indicating the integrated intensity of 12CO in the range of 18 to 160 K km s−1, with a step size of 5 K km s−1. The integration velocity range is 0–20 km s−1, which is consistent across panels (b), (c), and (d). The beam size is shown in the bottom left corner, and the scale length of 10 pc is shown in the bottom right corner. (b) The background shows the number of Gaussian components of the 13CO spectra, with contours showing the integrated intensity of 13CO ranging from 3 to 49 K km s−1, with a step size of 1.2 K km s−1. (c) The background shows the number of Gaussian components of the C18O spectra, with contours showing the integrated intensity of C18O ranging from 0.5 to 7 K km s−1, with s step size of 1 K km s−1. (d) The background shows the optical depth of 13CO, with the same contours as in panel (b).
Current usage metrics show cumulative count of Article Views (full-text article views including HTML views, PDF and ePub downloads, according to the available data) and Abstracts Views on Vision4Press platform.
Data correspond to usage on the plateform after 2015. The current usage metrics is available 48-96 hours after online publication and is updated daily on week days.
Initial download of the metrics may take a while.