Fig. B.1
Download original image
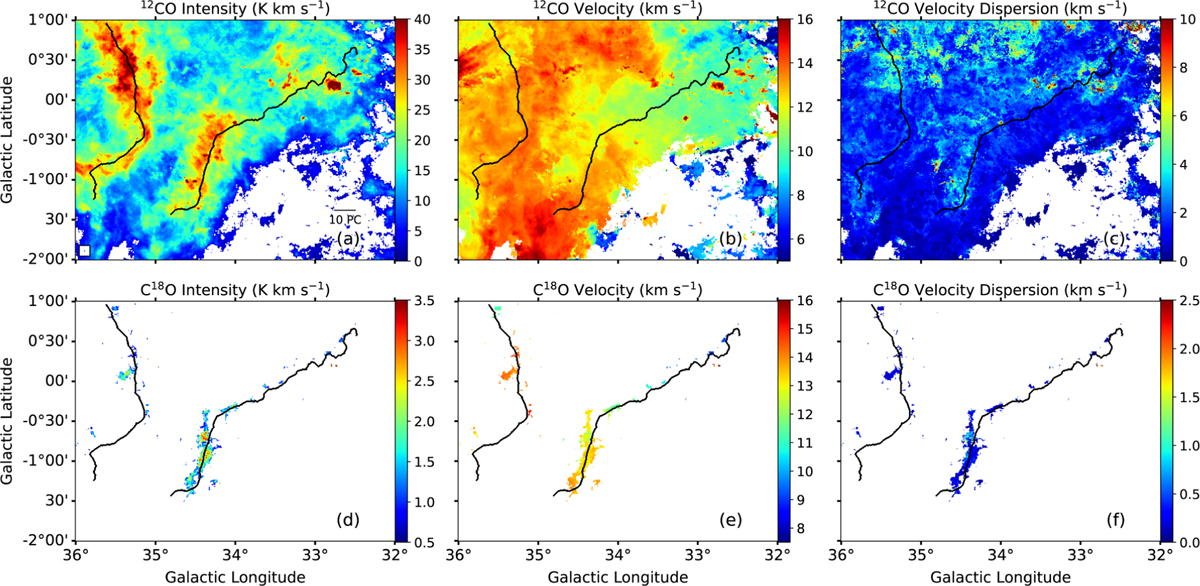
The black curves in all six panels indicate the filament skeletons. Panels (a) and (d) show the integrated-intensity maps of 12CO and C18O, respectively, with a velocity range of 0–20 km s−1. Panels (b) and (e) present the Local Standard of Rest (LSR) velocity maps of 12CO and C18O, respectively. Panels (c) and (f) display the velocity dispersion maps of 12CO and C18O, respectively.
Current usage metrics show cumulative count of Article Views (full-text article views including HTML views, PDF and ePub downloads, according to the available data) and Abstracts Views on Vision4Press platform.
Data correspond to usage on the plateform after 2015. The current usage metrics is available 48-96 hours after online publication and is updated daily on week days.
Initial download of the metrics may take a while.