Fig. C.1
Download original image
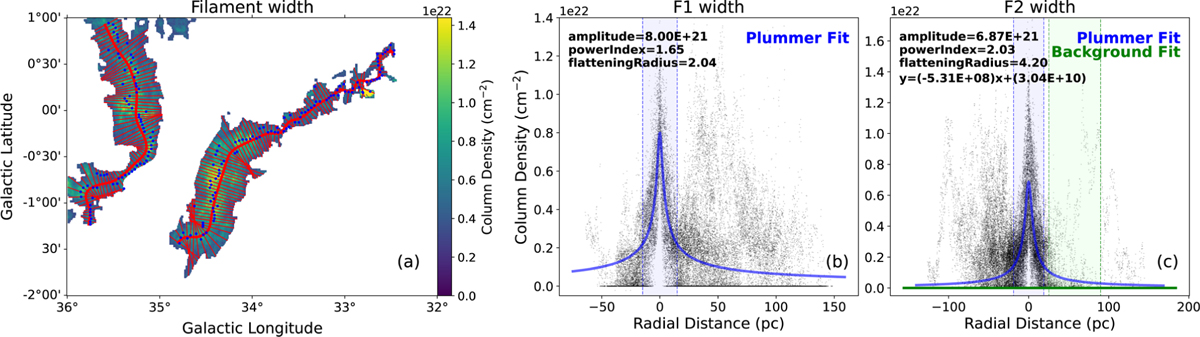
(a) Sampling results of filament width. The background is the H2 column density with the Filfinder mask applied. The red curves represents the filament spines. The thin red lines are vertical cuts perpendicular to the filament spine at each sampling interval. The blue dots are the density peaks on each cut. (b) and (c) The width fitting results for F1 and F2, along with the profile peak height, flattening radius, and density profile index, are noted in the upper left corner of the panels. The blue curves represent the Plummer function fitting curves, and the blue dashed line indicates the fitting interval of the Plummer function. The horizontal green solid line in the panel of (c) represents the fitting background straight line, and the green shaded region indicates the area of the baseline fitting, which uses a linear function, with the equation shown in the upper left corner of the panel. Due to the lack of a flatter region in the profile peak distribution of F1, the baseline fitting of the profile peak distribution is not performed for F1.
Current usage metrics show cumulative count of Article Views (full-text article views including HTML views, PDF and ePub downloads, according to the available data) and Abstracts Views on Vision4Press platform.
Data correspond to usage on the plateform after 2015. The current usage metrics is available 48-96 hours after online publication and is updated daily on week days.
Initial download of the metrics may take a while.