Fig. 2
Download original image
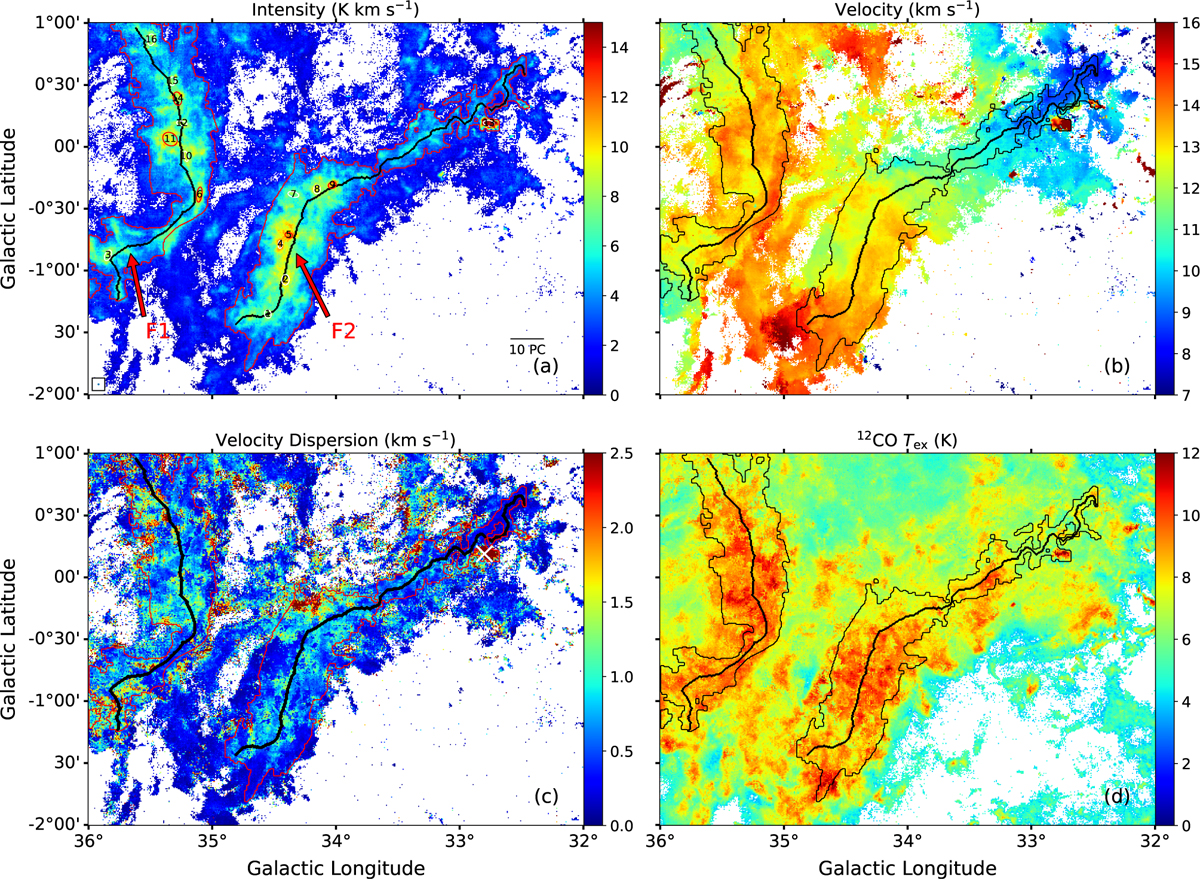
Plots of the main skeleton of the two filaments identified by Filfinder in black lines on the map. The closed contours in the four panels indicate the boundaries of the F1 and F2 masks created in Sect. 3.3, which are shown in red in panels a and c and in black in panels b and d. (a) Integrated-intensity moment-0 map for 13CO (J = 1−0), integrated over the velocity range of 0–20 km s−1 toward G34. The white and red circles mark the dense clumps identified in Sect. 3.6, and red circles represet clumps in a state of virial collapse. The clump IDs correspond to those listed in Table 2. The beam size is shown in the bottom left corner, and the scale length of 10 pc is shown in the bottom right corner, (b) The 13CO LSR velocity moment-1 map shows the different velocity gradients within the two filaments, (c) 13CO full width to half-power moment-2 map showing the higher velocity dispersion in the gravitational centers of the two filaments. The white cross marks the H II region G32.80+0.19, which may cause the high-velocity dispersion, (d) Excitation temperature (Tex) distribution derived from 12CO (J = 1−0). See Sect. 3.3 for the calculation details.
Current usage metrics show cumulative count of Article Views (full-text article views including HTML views, PDF and ePub downloads, according to the available data) and Abstracts Views on Vision4Press platform.
Data correspond to usage on the plateform after 2015. The current usage metrics is available 48-96 hours after online publication and is updated daily on week days.
Initial download of the metrics may take a while.