Fig. 4
Download original image
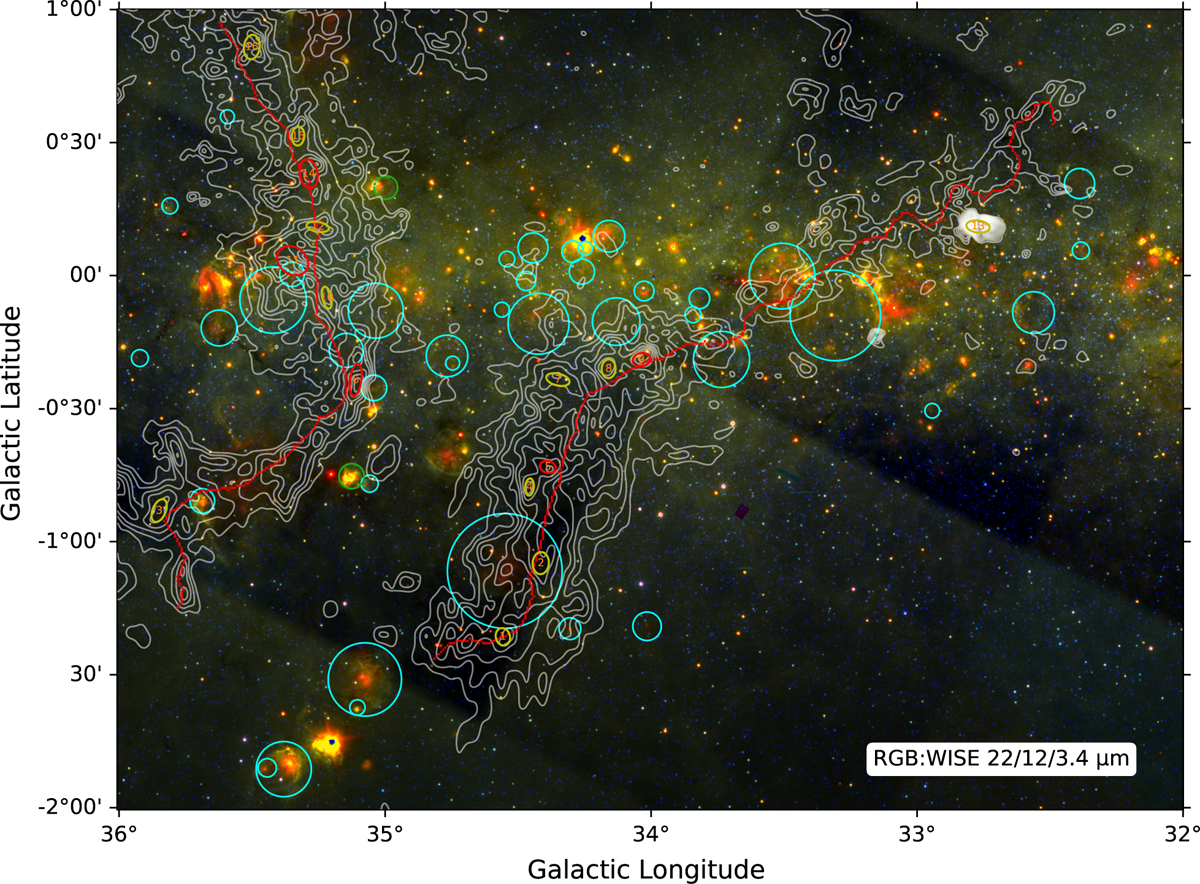
Three-color composite image of WISE 3.4, 12, and 22 μm bands (background). Red, green, and blue represent 22, 12, and 3.4 μm, respectively. The white contours represent the integrated intensity of 13CO, with values ranging from 3 to 49 K km s−1 with a step size of 1.2 K km s−1 integrated between 0 and 20 km s−1. The cyan and green circles indicate H II regions cataloged by WISE in the Galaxy, where green circles indicate H II regions that are likely within the same area in G34. The red and yellow circles denote the dense clumps identified by Astrodendro, with red circles indicating virially collapsing clumps. The numbers within the circles correspond to the clump numbers in the second row of the panels in Fig. 8. The red curves highlight the skeletons of the two filaments identified by Filfinder.
Current usage metrics show cumulative count of Article Views (full-text article views including HTML views, PDF and ePub downloads, according to the available data) and Abstracts Views on Vision4Press platform.
Data correspond to usage on the plateform after 2015. The current usage metrics is available 48-96 hours after online publication and is updated daily on week days.
Initial download of the metrics may take a while.