Fig. 6
Download original image
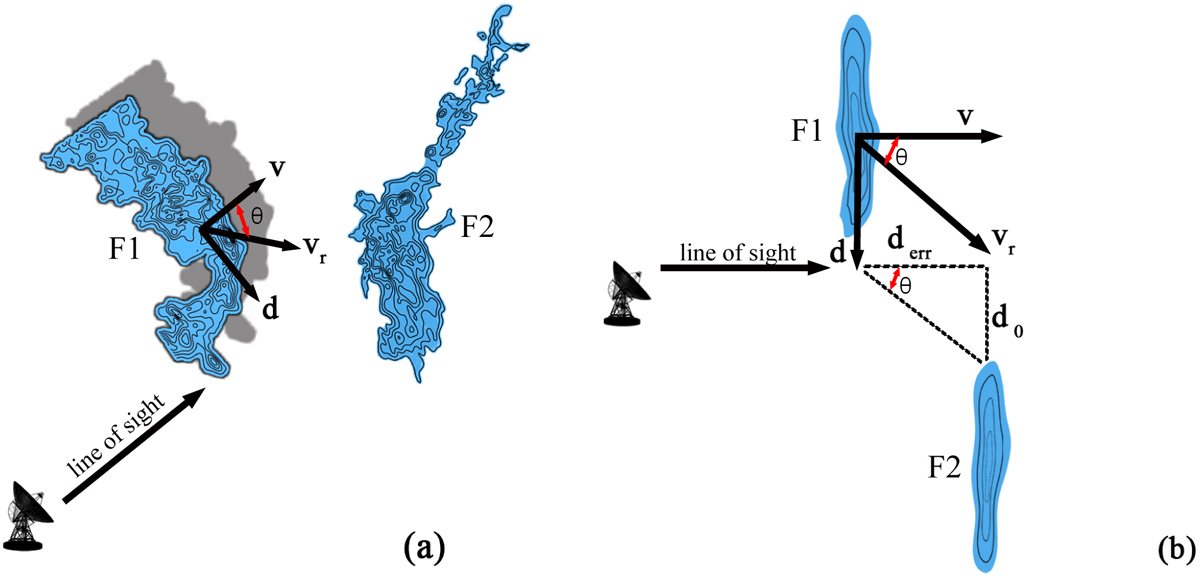
(a) Spatial distribution of F1 and F2. The shadow behind F1 represents its projection onto the plane of the sky. (b) Top view of the spatial distribution of F1 and F2. The angle θ represents the angle between the line-of-sight velocity v and the approaching velocity vr, and d denotes the unit distance perpendicular to the line-of-sight plane. derr indicates the distance difference between F1 and F2 from Earth, and d0 is the distance difference perpendicular to the line of sight of the two ends of the two filaments. d0 is also marked in Fig. 7.
Current usage metrics show cumulative count of Article Views (full-text article views including HTML views, PDF and ePub downloads, according to the available data) and Abstracts Views on Vision4Press platform.
Data correspond to usage on the plateform after 2015. The current usage metrics is available 48-96 hours after online publication and is updated daily on week days.
Initial download of the metrics may take a while.