Open Access
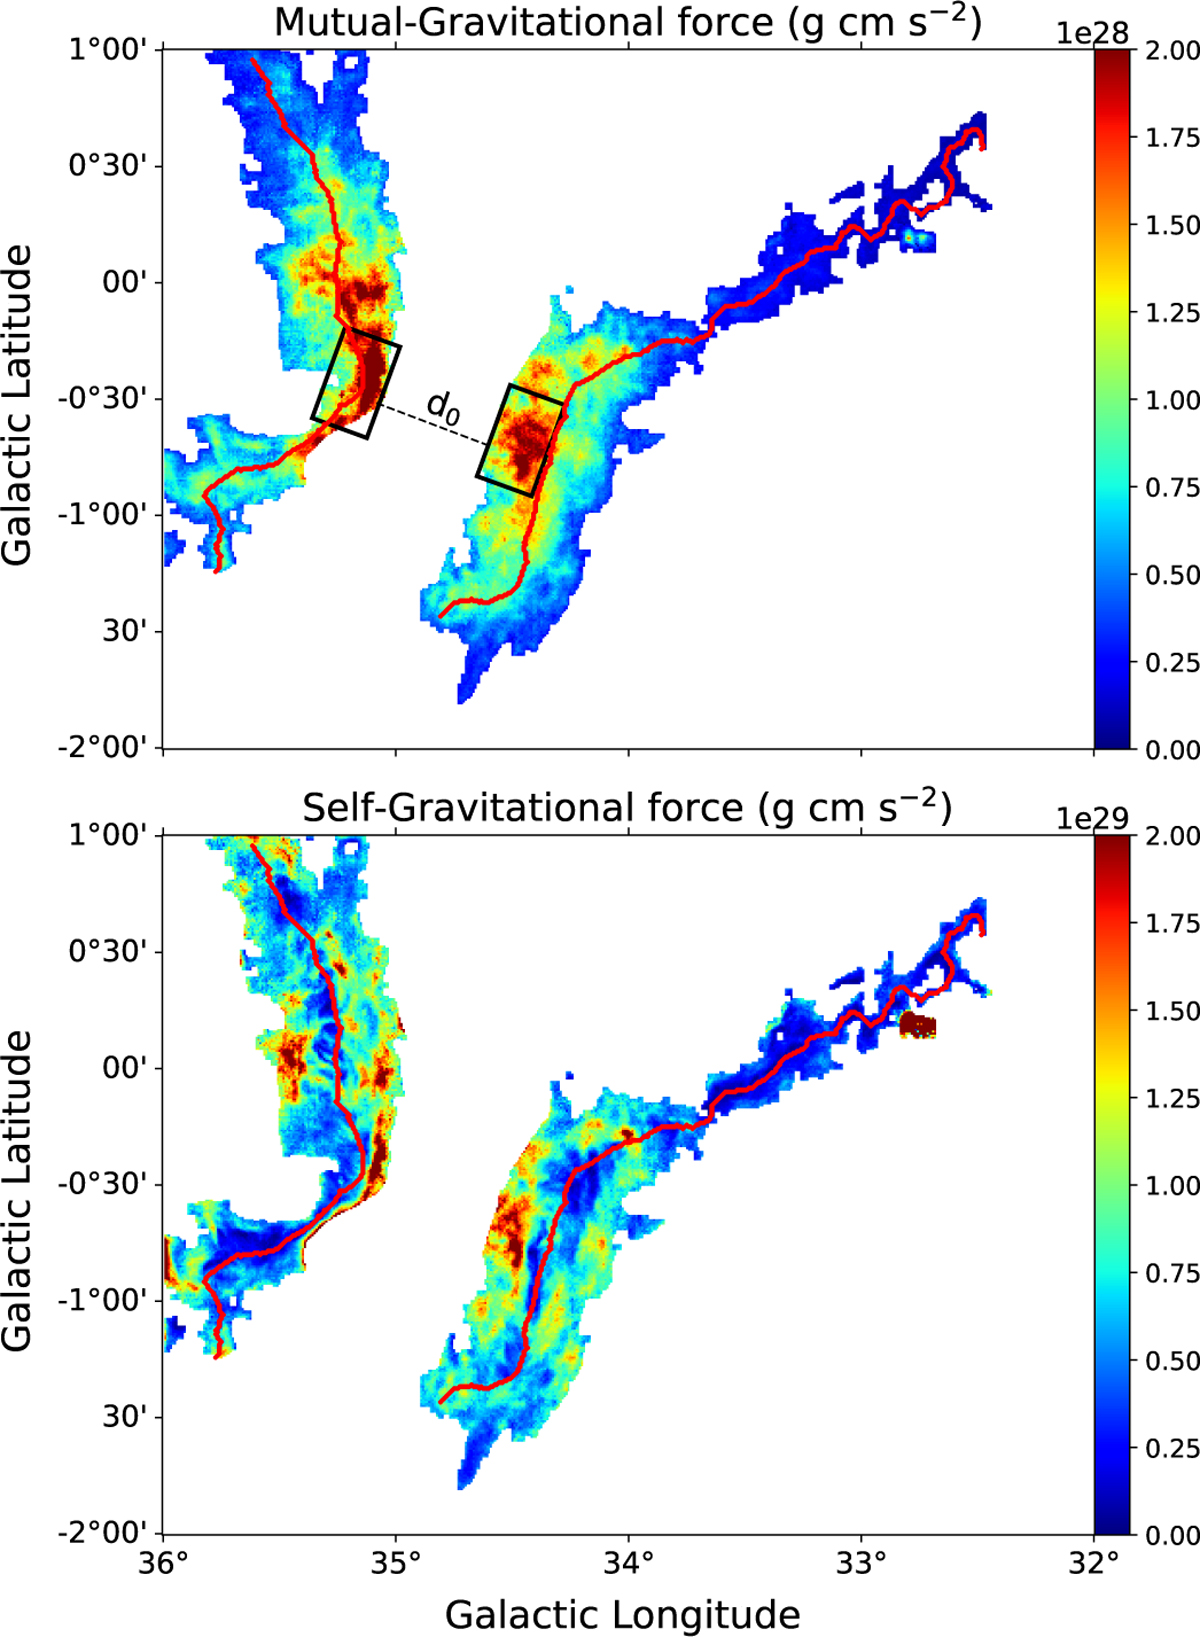
Fig. 7
Download original image
Distribution of self-gravitational and mutual gravitational forces in F1 and F2. The red curves represent the spines of F1 and F2. The black boxes highlight the regions that are exposed to particularly high mutual gravity. The dashed line and d0 indicate the projected distance of the mutual centers of gravity.
Current usage metrics show cumulative count of Article Views (full-text article views including HTML views, PDF and ePub downloads, according to the available data) and Abstracts Views on Vision4Press platform.
Data correspond to usage on the plateform after 2015. The current usage metrics is available 48-96 hours after online publication and is updated daily on week days.
Initial download of the metrics may take a while.