Fig. 8
Download original image
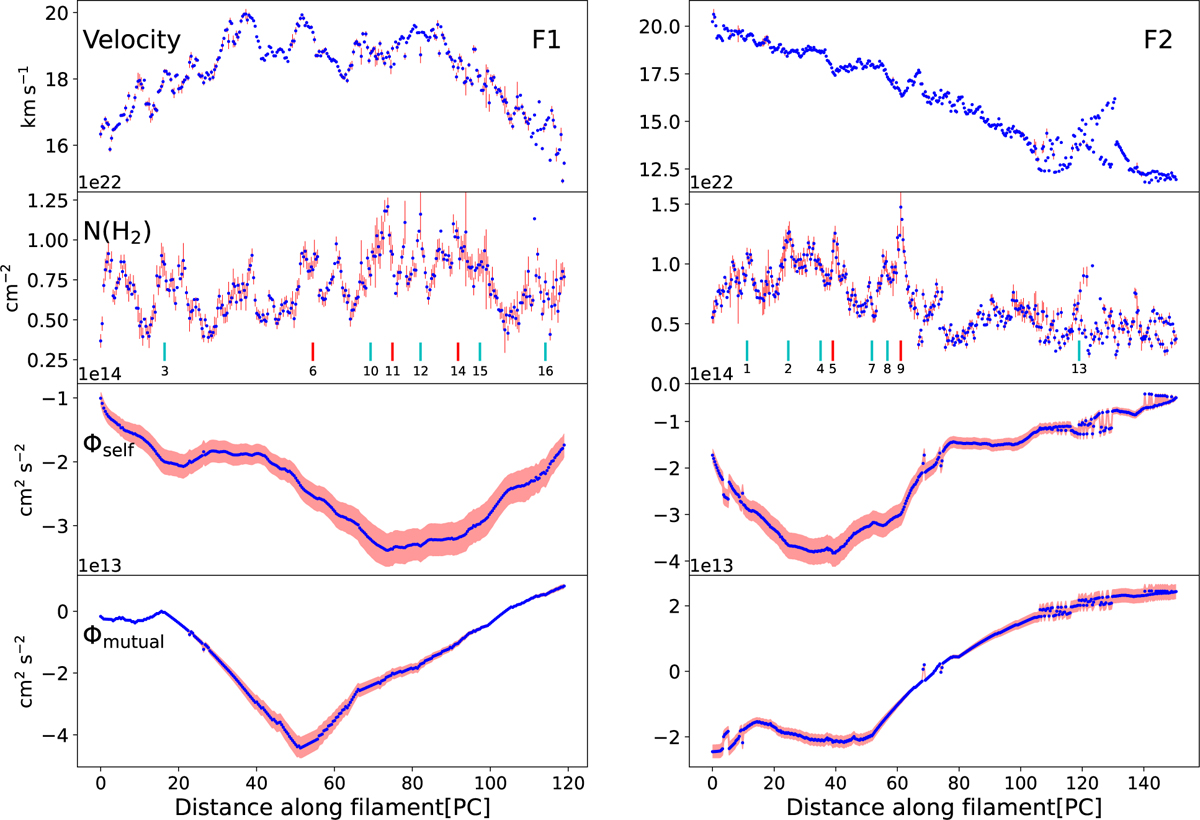
Velocity variations along the spines of F1 and F2, along with the changes in the hydrogen column density, self-gravitational potential Φself, and mutual gravitational potential Φmutual. In the hydrogen column density panel, the positions and numbers of the corresponding clumps along the spines are labeled. The red labels indicate clumps that are in a state of virial collapse. The clump identification and detailed physical parameters are described in Sect. 3.6 and listed in Table 2.
Current usage metrics show cumulative count of Article Views (full-text article views including HTML views, PDF and ePub downloads, according to the available data) and Abstracts Views on Vision4Press platform.
Data correspond to usage on the plateform after 2015. The current usage metrics is available 48-96 hours after online publication and is updated daily on week days.
Initial download of the metrics may take a while.