Fig. 9
Download original image
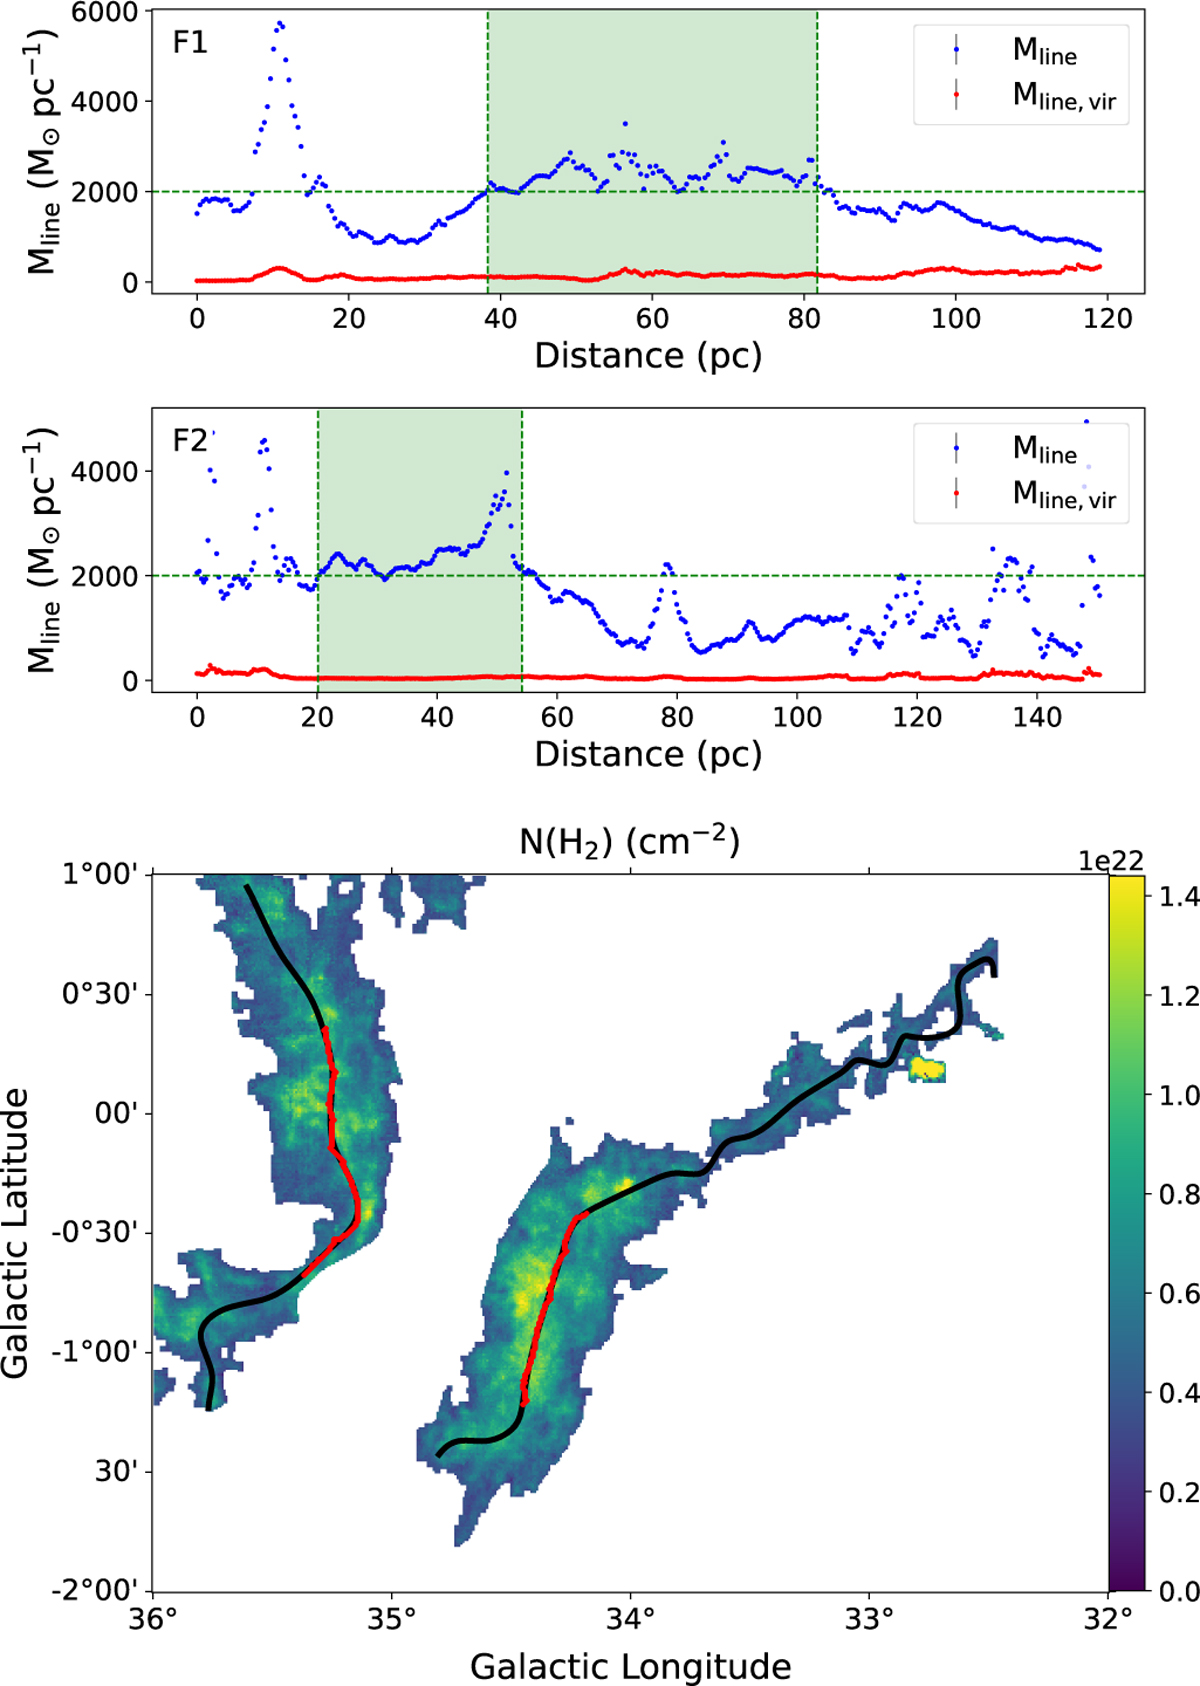
Scatter points in the panels in the first and second row represent the variations of the line mass (blue) and the virial mass (red) for F1 and F2. The two green shaded areas represent the interval, where the line mass is greater than 2000 M⊙ pc−1. The background of the bottom panel shows the molecular hydrogen column density. The black curves correspond to the skeleton of F1 and F2, and the red curves correspond to the intervals of the skeleton marked by the green shaded areas in the upper panels.
Current usage metrics show cumulative count of Article Views (full-text article views including HTML views, PDF and ePub downloads, according to the available data) and Abstracts Views on Vision4Press platform.
Data correspond to usage on the plateform after 2015. The current usage metrics is available 48-96 hours after online publication and is updated daily on week days.
Initial download of the metrics may take a while.