Open Access
Fig. 1
Download original image
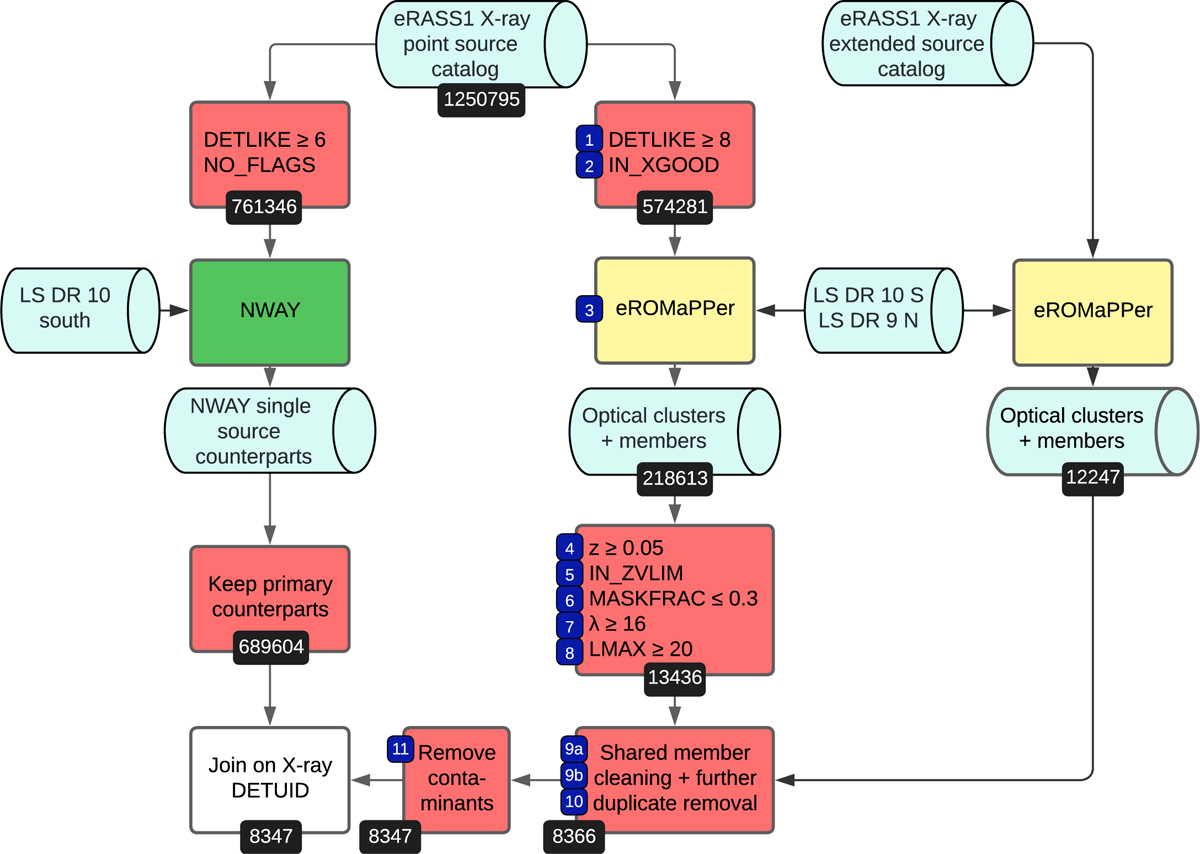
Illustration of the data flow discussed in Sect. 3.1 for assembling the cleaned and merged sample. The number of remaining sources after the selected steps is annotated in black. The respective filtering steps described in Sect. 3.1.1 are annotated in the blue boxes.
Current usage metrics show cumulative count of Article Views (full-text article views including HTML views, PDF and ePub downloads, according to the available data) and Abstracts Views on Vision4Press platform.
Data correspond to usage on the plateform after 2015. The current usage metrics is available 48-96 hours after online publication and is updated daily on week days.
Initial download of the metrics may take a while.