| Issue |
A&A
Volume 701, September 2025
|
|
|---|---|---|
| Article Number | A283 | |
| Number of page(s) | 23 | |
| Section | Catalogs and data | |
| DOI | https://doi.org/10.1051/0004-6361/202553942 | |
| Published online | 25 September 2025 | |
The first SRG/eROSITA All-Sky Survey
Characterization of clusters of galaxies misclassified in the eRASS1 point source catalog
1
Max-Planck-Institut für Extraterrestrische Physik,
Gießenbachstraße,
85748
Garching,
Germany
2
Institute for Frontiers in Astronomy and Astrophysics, Beijing Normal University,
Beijing
102206,
China
3
IRAP, Université de Toulouse, CNRS, UPS, CNES,
31028
Toulouse,
France
4
INAF, Osservatorio di Astrofisica e Scienza dello Spazio,
via Piero Gobetti 93/3,
40129
Bologna,
Italy
5
Universität Innsbruck, Institut für Astro- und Teilchenphysik,
Technikerstr. 25/8,
6020
Innsbruck,
Austria
6
Arnold Sommerfeld Center for Theoretical Physics, LMU Munich,
Theresienstr. 37,
80333
München,
Germany
7
Leibniz-Institut für Astrophysik Potsdam (AIP),
An der Sternwarte 16,
14482
Potsdam,
Germany
★ Corresponding author: This email address is being protected from spambots. You need JavaScript enabled to view it.
Received:
28
January
2025
Accepted:
15
May
2025
Abstract
The detection of the extended X-ray emission of the intracluster medium by the first SRG/eROSITA All-Sky Survey (eRASS1), combined with optical and near-infrared follow-up, resulted in the identification of more than 12 000 galaxy clusters, yielding precise constraints on cosmological parameters. However, some clusters of galaxies can be misclassified as point sources by eROSITA’s source detection algorithm due to the interplay between the point spread function, the shallow depth of the survey, compact (cool core) X-ray emission, and bright active galactic nuclei hosted in their centers or nearby. To identify such misclassified galaxy clusters and groups, we apply optical follow-up to the eRASS1 X-ray point sources analogously to the treatment of the extent-selected catalog. After rigorous filtering to ensure purity, we find a total of 8347 clusters of galaxies, of which 5819 are novel detections, in a redshift range 0.05 < z ≲ 1.1. This corresponds to a 70% discovery rate, a fraction similar to that of the extent-selected sample. To facilitate finding new exceptional clusters such as the Phoenix cluster (which is recovered in our sample), we divide the clusters into five classes based on the optical properties of likely single-source counterparts to the X-ray emission. We further investigate potential biases in our selection process by analyzing the optical and X-ray data. With this work, we provide a catalog of galaxy clusters and groups in the eRASS1 point source catalog, including their optical and X-ray properties along with a meaningful classification.
Key words: galaxies: clusters: general / galaxies: groups: general / X-rays: galaxies: clusters
© The Authors 2025
 Open Access article, published by EDP Sciences, under the terms of the Creative Commons Attribution License (https://creativecommons.org/licenses/by/4.0), which permits unrestricted use, distribution, and reproduction in any medium, provided the original work is properly cited.
This article is published in open access under the Subscribe to Open model.
Open Access funding provided by Max Planck Society.
1 Introduction
Understanding the astrophysical properties and the statistical signatures of the population of clusters of galaxies plays a crucial role in constraining the fundamental parameters of our Universe. Most baryons in clusters are encapsulated in the intracluster medium (ICM), which, due to the baryons’ large gravitational potential wells, emits mainly in the X-ray band through thermal Bremsstrahlung. However, minor contributions to the overall baryonic budget in clusters are provided by galaxies, whose stellar light allows optical and near-infrared detection. Additionally, the energetic electrons in the ICM interact with the cosmic microwave background (CMB) through inverse Compton scattering, which is known as the Sunyaev–Zel’dovich (SZ) effect (Sunyaev & Zeldovich 1972). These observational signatures of the various components of clusters of galaxies in the electromagnetic spectrum are widely used to facilitate their detection. This is the basis for statistical analyses, where a thorough study of cluster count statistics can tightly constrain cosmological parameters (see for example the review by Clerc & Finoguenov 2023, and the references therein).
Surveys based on the various observational tracers have been conducted, each with their strengths and weaknesses. Largearea photometric surveys in the optical band, performed mainly via ground-based telescopes, usually identify galaxy clusters by detecting the characteristic overdensity of early-type galaxies known as the red sequence (Dressler 1980). The red sequence is exhibited through a tight linear relationship in color-magnitude space (Bower et al. 1992). These surveys use photometric data to select the clusters (e.g., Gladders & Yee 2000; Oguri 2014; Rykoff et al. 2016), which can be affected by projection effects (Zu et al. 2017; Busch & White 2017). Cluster surveys that rely on detecting signatures of the SZ effect are less affected by projection effects, and enable cluster detection at high redshifts; catalogs based on this selection method have high completeness. However, they are limited by the angular resolution of the instruments (for overviews of SZ cluster surveys conducted using various telescopes, see, e.g., Planck Collaboration XXIX (2014) for the Planck Space Telescope; Bleem et al. (2015) for the South Pole Telescope, SPT; or Hilton et al. (2021) for the Atacama Cosmology Telescope).
Cluster surveys in the X-ray band are also sensitive to the emission from the hot ICM. The spatial resolution of X-ray telescopes is typically higher than that of those used for SZ surveys, and projection effects are far less severe than in the optical; X-ray surveys are thus well-suited to detecting large samples of clusters of galaxies and to studying their statistical properties. The first wide-area X-ray cluster surveys include but are not limited to the NORAS survey in the Northern Hemisphere (Böhringer et al. 2000), and the REFLEX survey in the Southern Hemisphere (Böhringer et al. 2004), both derived from the ROSAT All-Sky Survey (RASS, Voges et al. 1999). Cluster surveys with limited area coverage but deeper observations with XMM-Newton bridge this first All-Sky X-ray survey and next generation X-ray surveys (Adami et al. 2018; Liu et al. 2022).
The extended ROentgen Survey with an Imaging Telescope Array (eROSITA) on board the Spektrum Roentgen Gamma (SRG) mission, which is a wide-field X-ray instrument, completed its first All-Sky Survey (hereafter eRASS1) six months after its launch in June 2020 (Sunyaev et al. 2021; Predehl et al. 2021). The first catalog of ~1.1 million X-ray sources in the Western Galactic Hemisphere is presented in Merloni et al. (2024). Based on this catalog, Bulbul et al. (2024, B24 hereafter) and Kluge et al. (2024, K24 hereafter) selected 12 247 clusters of galaxies via their extended X-ray emission, compiling a sample with redshifts up to z = 1.3. The details of the optical identification scheme and the X-ray properties of these clusters and sample properties are presented in K24 and B24, respectively.
Clusters of galaxies in the eROSITA source catalogs are characterized based on their extent (EXT), extent likelihood (ℒext), and detection likelihood (ℒdet) (Brunner et al. 2022; Liu et al. 2022, B24). Due to the sizable point spread function (PSF; survey averaged ~30″ HEW; Merloni et al. 2024) of eROSITA, galaxy clusters with peaked cool-core emission at higher redshifts or clusters hosting active galactic nuclei (AGN) in their central regions are sometimes misclassified as point sources. This can lead to their omission from the extent-selected sample. One infamous example of such a misclassification is the Phoenix cluster, which was first detected in the RASS. Due to its emission’s extent, which was comparable to the PSF of ROSAT, and an association with an AGN in the optical, it was classified as a point source and thus discarded from the cluster catalogs. Only more than ten years later was it revealed to be a massive galaxy cluster at z = 0.597 (McDonald et al. 2012), uncovered by an observation in the millimeter-wave band with the SPT (Carlström et al. 2011). The realization that such clusters are missed in the extent-selected searches sparked thorough investigations of the RASS bright source catalogs (Green et al. 2017; Donahue et al. 2020; Somboonpanyakul et al. 2021), including studies focused on the interaction of the central AGN and brightest cluster galaxies (BCGs), and X-ray and optical followup observations. One challenging aspect of employing X-ray surveys in population studies involves modeling the selection function, which assesses the completeness of the extent-selected sample (see Clerc et al. 2018, 2024, for further details). Detecting misclassified clusters can help us understand these selection effects.
Since eRASS1 with a median flux limit of ~5 × 10⁻¹⁴ erg s−1 cm−2 in the 0.2 to 2 keV band (see Fig. 9 in Merloni et al. 2024) is already deeper than the RASS, which had a limit of ~10−13 erg s−1 cm−2 in the 0.1 to 2.4 keV band (Boller et al. 2016), a first assessment of the abundance and nature of misclassified clusters was conducted on the eROSITA Final Equatorial Depth Survey (eFEDS) data by Salvato et al. (2022) and Bulbul et al. (2022). Studies of the eFEDS field showed a nonnegligible number of galaxy clusters and groups (346, compared to the 542 extent-selected clusters) to remain in the eFEDS point source catalog. This catalog was obtained via the application of an extent likelihood cut of ℒext ≥ 6 (Liu et al. 2022). Of these misclassified clusters, only a small fraction of ~10 % seemed to host an AGN in their centers. The majority of clusters were missed by the extent-selection due to having fluxes below the flux limit. With the same separation scheme, Bulbul et al. (2022) predicted ~6000 misclassified clusters to be found in eRASS1, with ~400 candidates hosting AGN in their BCGs. The authors recommended lowering the ℒext cut (with the downside of increasing contamination of the extent-selected sample) to recover more of these clusters. As a result, to keep the majority of high-redshift clusters with bright cores and compact groups, a cut of ℒext ≥ 3 was adopted to construct the primary eRASS1 cluster catalog (B24). Even with this reduced ℒext cut, underluminous clusters and clusters hosting an AGN in their cores can be included in the remaining X-ray point sources. Furthermore, bright AGN point source emission can outshine and thus disguise the fainter extended emission of clusters.
The aim of this paper is to characterize galaxy clusters found at the positions of eRASS1 X-ray point sources. We based our work on an identification of a red sequence in the optical and infrared using the eROMaPPer algorithm (Ider Chitham et al. 2020; Kluge et al. 2024), and on the properties of single-source counterparts identified via the NWAY algorithm (Salvato et al. 2018; Salvato 2025). With this information, we assembled a comprehensive sample of interesting clusters of galaxies that had otherwise been missed by the extent-selection cuts in the main eRASS1 cluster catalog. This sample can be used as a foundation for various astrophysical studies: The cool-core clusters with prominent point-like X-ray flux will enable extensive analysis of the AGN feedback cycle, while optical clusters associated with background quasars will allow absorption line studies of the ICM. Numerous high-redshift clusters, which can be used in evolutionary studies of clusters of galaxies, are also part of this sample.
This paper first introduces the underlying X-ray and optical data in Sect. 2, followed by a description of the filtering and classification procedure in Sect. 3. A comparison to a selection of optical, X-ray, and SZ surveys is performed in Sect. 4. We then characterize the sample by the optical properties of the clusters and the single-source counterparts in Sect. 5, followed by a discussion of the X-ray properties in Sect. 6. Finally, our results are summarized in Sect. 7. Throughout this paper, we assume a flat ΛCDM cosmology with H0 = 70 km/s/Mpc, Ωm = 0.3, and σ8 = 0.8. Redshifts are provided in the heliocentric frame of reference, and no corrections are applied for Virgo infall or the CMB dipole moment.
2 X-ray, optical, and near-infrared data
In this section, we introduce the data used throughout this paper. We describe the X-ray catalogs used in Sect. 2.1. We then introduce the photometric optical and near-infrared data in Sect. 2.2 as it is used both for optical cluster follow-up and the single source counterpart identification. Next, in Sect. 2.3, we briefly describe the data products obtained from the red-sequence-based cluster finding algorithm eROMaPPer, followed by a description of the NWAY single-source counterparts to the X-ray point sources in Sect. 2.4, and a brief summary of how photometric redshifts for these counterparts are determined.
2.1 X-ray data
The first eROSITA All-Sky Survey (eRASS1, Merloni et al. 2024) catalogs include X-ray-detected point-like and extended sources in the Western Galactic half of the eROSITA sky, i.e., at a Galactic longitude 179.9442 deg < l < 359.9442 deg. The calibration and source detection algorithms used in creating the catalogs are described in detail in Sect. 4.3.2 of Merloni et al. (2024). In short, the eROSITA Science Analysis Software System (eSASS, Brunner et al. 2022)1 is used in pipeline configuration 010, which, in comparison to the eFEDS processing c001, performs a stronger telescope module specific noise suppression for pattern events, more accurately computes the subpixel position, has improved flagging of pixels neighboring bad pixels, and has an improved projection accuracy.
The ICM of galaxy clusters has an extended appearance in the X-rays, setting it apart from AGN and stars that appear consistent with eROSITA’s PSF. This offers a natural selection criterion for galaxy clusters given the eRASS1 X-ray data. The sample of extended X-ray objects, i.e., objects with an extent likelihood ℒext ≥ 3, is described in B24, including all sources above an X-ray detection likelihood of ℒdet ≥ 6. Further cleaning of the sample was performed via optical identification using the eROMaPPer red sequence-based cluster finding algorithm (Sect. 2.3), selecting 12 247 galaxy clusters in the common Legacy Survey DR9 (north) and DR10 (south) area K24. We use this sample for comparisons throughout this work. At the same time, more detailed analysis and further experiments have been conducted elsewhere, including a characterization of the selection function (Clerc et al. 2024), constraints on cosmology and general relativity (Ghirardini et al. 2024; Artis et al. 2024; Artis et al. 2025; Seppi et al. 2024; Grandis et al. 2024; Kleinebreil et al. 2025), a catalog of large scale structure and evolutionary studies (Liu et al. 2024a; Liu et al. 2024b), and studies of AGN feedback in galaxy groups (Bahar et al. 2024).
In this work, we complement the extent-selected catalog by identifying clusters hiding in plain sight, i.e., misclassified clusters which ended up in the point source catalog. The eRASS1 main catalog presented in Merloni et al. (2024) includes point sources selected from the 0.2 to 2.3 keV band. This catalog, comprising 1 250 795 sources selected by incorporating the detections with an extent of 0 and a detection likelihood of at least 5, is the basis of our analysis.
2.2 Optical and near-infrared data
For the optical and near-infrared galaxy cluster identification, we used the DESI Legacy Imaging Surveys (LS, Dey et al. 2019) similarly to K24. These are a collection of sky surveys obtained with four telescopes. They consist of the Dark Energy Camera Legacy Survey (DECaLS, Dey et al. 2019) in the g, r, i, and z bands in the southern sky at Dec ≲ 32.375 deg. We refer to this dataset as LS DR 10 south because it is taken from the 10th data release of the LS. In the northern sky at Dec ≳ 32.375°, the Beijing-Arizona Sky Survey (BASS, Zou et al. 2017) is used to cover the g and r bands while the Mayall z-band Legacy Survey (MzLS, Silva et al. 2016) is used to cover the z band. We refer to these two datasets as LS DR 9 north because, although they are included in data release 10, the data remains unchanged since data release 9. The overlap of the LS DR 10 south with eRASS1 is 12 791 deg2 (12 205 deg2) without (with) the i-band included, while LS DR 9 north has an overlap of 462 deg2. The calculation of these areas is described in Kluge et al. (2024), Appendix B.
The LS DR 9 data are only used for the cluster identification (Sect. 2.3), but not for the counterpart identification (Sect. 2.4). Additionally, for the full sky, near-to-mid-infrared data from the Near-Earth Object Wide-field Infrared Survey Explorer (NEOWISE, Lang 2014; Mainzer et al. 2014; Meisner et al. 2017a,b) is included to increase the wavelength range. Of these data, only the near-infrared W1 band at 3.4 μm is used for identifying the cluster counterparts of eRASS1 (see Sect. 2.3), and all bands are considered (when available) for the photometric redshift measurements of single-source counterparts (see Sect. 2.4).
Photometric measurements are consistently performed using The Tractor algorithm (Lang et al. 2016) based on seeing-convolved analytic models. Galaxy luminosities are given in AB magnitudes and were corrected for Galactic extinction.
2.3 eROMaPPer optical cluster follow-up for the X-ray point sources
Galaxy clusters are identified using the red-sequence-based optical cluster finding algorithm eROMaPPer (Ider Chitham et al. 2020; Kluge et al. 2024), adopted to the eROSITA source confirmation process based on the redMaPPer algorithm (Rykoff et al. 2012; Rykoff et al. 2014; Rykoff et al. 2016). The optical identification is employed in scanning mode on the full eRASS1 sample, consisting of 26 682 extended and 1 250 795 point-like X-ray detections with a detection likelihood ℒdet≥5 (Merloni et al. 2024). Results for the extended sources (ℒext≥3) are published (K24; B24). In this work, we study the results for clusters at positions of the point sources detected in eRASS1. This initial catalog contains many non-unique and spurious detections. Hence, we filter it further in Sect. 3.1. While the eROMaPPer algorithm is described in detail in K24, we briefly outline its most important outputs here:
When run in scanning mode (i.e., using positional priors), eROMaPPer iteratively searches for cluster member galaxies within a radius Rλ defined as
![Mathematical equation: $\[R_\lambda=R_0\left(\frac{\lambda}{100}\right)^\beta\]$](/articles/aa/full_html/2025/09/aa53942-25/aa53942-25-eq1.png) (1)
(1)
where λ is the richness (see Eq. (3)), and where the parameters R0 = 1.0h−1 Mpc and β = 0.2 were found to minimize the scatter within the redshift-richness relation (Rykoff et al. 2012; Rozo et al. 2011). The conversion from angular to physical scales is performed at the photometric redshift. Each of the galaxies within that radius is assigned a membership probability pmem that depends on the color distance from the red sequence model, the radial distance from the search location, and global galaxy background probability (Rykoff et al. 2014; Rykoff et al. 2016). As does redMaPPer, eROMaPPer constructs and evaluates a likelihood function ℒλ on a redshift grid,
![Mathematical equation: $\[\ln~ \mathcal{L}_\lambda(z)=-\frac{\lambda(z)}{S(z)}-\sum_i ~\ln~ \left(1-p_{\mathrm{mem}, i}(z)\right).\]$](/articles/aa/full_html/2025/09/aa53942-25/aa53942-25-eq2.png) (2)
(2)
The richness λ of a cluster is defined as
![Mathematical equation: $\[\lambda:=S ~\sum_i ~p_{\mathrm{mem}, i},\]$](/articles/aa/full_html/2025/09/aa53942-25/aa53942-25-eq3.png) (3)
(3)
where S is a scaling factor that depends on the fraction masked due to the flagged photometry of galaxies and the limited depth of the images. To be considered for the richness estimate, galaxies are required to have a minimum luminosity of L > fL*, where L* is the break of the Schechter luminosity function (Schechter 1976), and f a factor that varies depending on the available photometry for a given eROMaPPer run. Following Rykoff et al. (2012), f = 0.2 was employed for the grz and griz runs to minimize the scatter of the X-ray luminosity at fixed richness, and f = 0.4 was employed for the grzW1 and grizW1 runs to have an unbiased richness estimate for higher redshifts z > 0.8. To correct for the fact that the richness systematically decreases for a higher luminosity threshold applied to the member galaxies, a normalized richness λnorm is defined as
![Mathematical equation: $\[\lambda_{\text {norm }}=S_{\text {norm}} \lambda,\]$](/articles/aa/full_html/2025/09/aa53942-25/aa53942-25-eq4.png) (4)
(4)
with the normalization factor Snorm varying for each of the eROMaPPer runs (Snorm ≈ 1 for the runs with f = 0.2, and Snorm ≈ 2.4 for the runs with f = 0.4, see Table 2 of K24). For each positional input, eROMaPPer determines the maximum of the likelihood function ln ℒλ(zλ), using the zλ value that maximizes it as the photometric redshift. The associated richness λ and the maximum value ℒmax are registered. While both only depend on the membership probabilities, a lower ℒmax value for two clusters with identical richness can indicate a lower pmem for more members, which in turn can hint at an offset of the identified cluster to the input position or spurious member detections.
For each cluster and eROMaPPer run, a limiting redshift zvlim is calculated (see Appendix B in K24). zvlim is defined as the redshift at which member galaxies at the low-luminosity limit fL* can still be detected with a Signal-to-Noise ratio of 10 in the z-band. K24 caution (e.g., shown in their Fig. 13) that clusters with photometric redshifts zλ > zvlim are prone to contain false-positive detections, and therefore provide the IN_ZVLIM-flag defined as zλ ≤ zvlim for each cluster.
In addition to the quantities introduced above, eROMaPPer defines the BCG as the brightest member galaxy in the z band within Rλ. This choice has been shown to agree with other selection criteria based on extended stellar envelopes in ~80 % of the cases (see also Von Der Linden et al. 2007; Kluge et al. 2020).
2.4 NWAY single source counterparts for the X-ray point sources
For each of the Merloni et al. (2024) X-ray point sources, Salvato (2025) present single source counterpart associations in the optical and near-infrared, making use of the LS DR 10 data described in Sect. 2.2. For the task of identifying them, they employ the NWAY algorithm (Salvato et al. 2018) combined with a Machine Learning (ML) algorithm based on a Random Forest classifier. This ML algorithm, trained on more than 40 000 secure X-ray emitters (stars, compact objects, AGN, and QSOs), determined a model that, to each source in the LS DR 10 survey within one arcmin from the X-ray position, assigns the probability to be an X-ray emitter. The model takes into account the fluxes in the g, r, i, z and the 4 WISE bands, the constructed colors, and signal-to-noise. This probability is then combined with the probability determined on the basis of astrometry (i.e., separation, positional errors, and number density in the eROSITA and LS DR 10 catalogs) to rank each counterpart candidate.
To assess the reliability of these counterparts, Salvato (2025) randomized the coordinates of the eRASS1 point sources and re-applied the same model as for the real position. This allowed them to measure the distribution of pany (i.e., the probability that an eRASS1 source is correctly associated with a counterpart) for chance associations. Salvato (2025) show that in the area covered by LS DR 10, the accuracy and purity is higher than 95% already at very low pany.
2.4.1 Distinction between Galactic and extragalactic counterparts
In addition to providing the counterpart identification, Salvato (2025) also assess the Galactic/extragalactic nature of these counterparts, providing a class_gal_exgal parameter for each source. For this purpose, another ML algorithm, STAREX, was developed. A training sample of more than 22 000 elements (7735 stars and 14 517 extragalactic sources) was constructed, and the model was trained using g, r, z, WISE/W1 and X-ray fluxes, morphological information (expressed with TYPE from LS DR 10). For sources brighter than ~20 magnitudes in the g band, the proper motion and related error were gathered from Gaia DR3 (Gaia Collaboration 2016, 2023). On a validation sample, STAREX correctly identifies the Galactic/extragalactic nature of the sources in more than 98 % of the cases. Furthermore, other criteria introduced in Salvato et al. (2018, 2022) are adopted, together with the classification from SIMBAD, when available. In this work, we opted to utilize a binary classification between the Galactic and extragalactic nature of counterparts securely associated with X-ray emission. For this, we take into account both the assigned class_gal_exgal and the reliability of the counterpart photometry; if the photometry of a counterpart is considered unreliable, it will only be labeled as Galactic if class_gal_exgal = −5; otherwise, we label it as Galactic if class_gal_exgal < 3. This is encoded in the CTP_IS_GALACTIC flag.
2.4.2 Counterpart redshifts
For each LS DR 10 south extragalactic counterpart to an eRASS1 source, Salvato (2025) also compute photometric redshifts. These are determined using CIRCLEZ, an algorithm based on a Fully Connected Neural Network (FCNN) (Saxena et al. 2024). Unlike the standard approach, CIRCLEZ uses fluxes and colors within apertures in addition to total fluxes. The information on the light profile of the sources is indirectly related to the redshifts via the size. In terms of accuracy and the fraction of outliers CIRCLEZ, provides the same accuracy (5%) and a smaller fraction of outliers (<10%) than the photometric redshift computed in eFEDS, where SED fitting was applied to photometry from the UV, optical, near- and mid-infrared (Salvato et al. 2022).
In addition to these photometric redshifts, Salvato (2025) provide spectroscopic redshifts and associated errors for 83 646 sources collected from the literature. We define the best counterpart redshift zctp and associated 1σ errors as the spectroscopic redshift when available and photometric redshift otherwise.
3 Filtering and classifying the sample
Here, we describe how the final sample of misclassified galaxy clusters is obtained from the data described in the previous section. In Sect. 3.1, we outline the steps conducted to clean the initial catalog, followed by a description of the cluster classification scheme in Sect. 3.2.
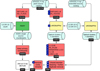 |
Fig. 1 Illustration of the data flow discussed in Sect. 3.1 for assembling the cleaned and merged sample. The number of remaining sources after the selected steps is annotated in black. The respective filtering steps described in Sect. 3.1.1 are annotated in the blue boxes. |
3.1 Catalog cleaning
We apply various filters on the X-ray point source catalog by Merloni et al. (2024) and the resulting cluster catalog obtained by eROMaPPer (Sect. 2.3) to ensure a high level of purity in the final catalog. The details of the filtering are laid out in Sect. 3.1.1. We further focus on a novel split source cleaning scheme in Sect. 3.1.2 and describe the contributions of different eROMaPPer run configurations in Sect. 3.1.3. We finally outline how the NWAY counterparts (Salvato 2025; Saxena et al. 2024, Sect. 2.4) are merged with this sample in Sect. 3.1.4. The data flow for the catalog assembly and cleaning is shown in Fig. 1.
3.1.1 Filtering steps
As described in Sect. 2.3, eROMaPPer is run in scanning mode on the full eRASS1 sample consisting of 26 682 extended and 1 250 795 point-like X-ray detections with a detection likelihood ℒdet≥5. This process is similar to the optical identification process of the extent-selected catalog (K24). The sample of optical cluster counterparts identified at the positions of the X-ray point sources via eROMaPPer is expected to be highly contaminated by projections and chance associations. We expect that only a low fraction truly has a cluster ICM contribution to the observed X-ray flux of the point source. In contrast to the extent-selected sample cleaning, we cannot rely on the Mixture Model (covered in detail in Ghirardini et al. 2024) to provide contamination probabilities. This is because the Mixture Model uses redshift and richness information of eROMaPPer detections both at positions of point sources and of random points to infer said contamination probability. Therefore, we have shifted our aim to assembling a catalog of misclassified clusters with high purity. To achieve this, we apply the following conservative cuts on the sample (also mentioned in Fig. 1):
As a first step, we clean the initial 1 250 795 X-ray point sources by employing a cut on the detection likelihood DET_LIKE_0 of ℒdet ≥ 8, reducing the sample to 576 154 point sources. For this cut, contamination from spurious sources of less than 4% is to be expected according to Table 3 of Seppi et al. (2022), which we deem to be a good trade-off to reach high purity on the input.
In addition to that, we mask regions of known noncluster extended X-ray sources such as supernova remnants, positions of known X-ray binaries and globular clusters, and the region of the Virgo cluster (denoted by the flag IN_XGOOD), which was analogously performed for the extent-selected cluster catalog (B24; K24). This removes an area equivalent to 62 deg2, reducing the total area to 13 116 deg2, and the number of considered point sources to 574 281.
For 218 613 of those X-ray point sources, eROMaPPer could identify a cluster candidate with optical properties (redshifts, richnesses, optical centers, and BCG positions). No optical overdensity of red-sequence galaxies could be found at the positions of the remaining point sources.
The minimum redshift for the red sequence model employed by eROMaPPer is zmin = 0.05 (see Appendix C in K24). The final photometric redshift inferred by eROMaPPer can still be lower but is highly unreliable as the model was not calibrated in that regime. We, therefore, exclude clusters with zbest ≤ zmin for further analysis, leaving 215 579 cluster candidates.
As described in Sect. 2.3, eROMaPPer calculates the limiting redshift zvlim for each identified cluster based on the z-band survey depth and a limiting luminosity Lthresh, which varies based on whether the W1 band was used in the run. To limit the amount of false-positive detections, in contrast to the extent-selected catalog, we from here on only consider detections that are IN_ZVLIM (i.e., zλ < zvlim), further limiting the sample to 158 774 cluster candidates.
The eROMaPPer algorithm discards sources that have specific MASKBITS assigned in the LS (e.g., due to bright nearby objects) and accounts for this via the scaling factor S in the richness estimate (see Eq. (3)). The MASKFRAC parameter fmask provided for each optical cluster describes the fraction of potential members masked this way. We apply a cut at fmask ≤ 0.3 to exclude clusters with high masking fractions, reducing the sample to 151 628 cluster candidates. Since eROMaPPer was tiled into heal pixels to allow parallelization, some clusters near the edges of these heal pixels were unintentionally cropped, especially affecting clusters at low redshift due to their larger extent on the sky. As noted in Appendix A of K24, this concerns a few percent of the removed clusters, especially those with fmask ≲ 0.6. We thus expect to lose a few hundred clusters (in the final sample) due to this effect by applying our specific MASKFRAC cut. This is acceptable since we strive for a pure sample, which this cut warrants by removing candidates heavily masked due to nearby bright stars.
Since the relative amount of contamination and chance alignments is especially high for the low-richness detections (Fig. 14 in K24), we employ a richness cut of λnorm ≥ λmin = 16. K24 found this value to roughly correspond to a DES Y1 (optical clusters found using redMaPPer, Abbott et al. 2020) richness of λDES ≈ 20, i.e., clusters with M200 ≳ 1014 M⊙. This filtering step leaves 23 947 cluster candidates.
Through visual inspection of the sample obtained at this point, we noticed that the richness cut is sometimes not enough to exclude contaminants, i.e., eROMaPPer cluster candidates found far from the X-ray detection with a clearly different center. We have found the ℒmax value to be a good indicator of such contaminants, and after extensive visual inspection and comparison to the catalog run on random positions, we decided to discard all candidates with ℒmax < 20. This reduces the sample to 13 436 cluster candidates.
In the next step, we identify and discard duplicate sources, i.e., separate point sources for which eROMaPPer has matched virtually the same optical clusters. The details of this step are laid out in Sect. 3.1.2 and further in Appendix B. In short, we use a joint catalog of member galaxies of the 13 436 remaining misclassified candidates and the extent-selected clusters (B24; K24). This allows us to identify 9518 cluster candidates that share high fractions of members with other candidates or extent-selected clusters. If a candidate has such shared fractions with multiple other candidates, we associate them with each other in a transitive fashion (i.e., we include all candidates for which this is the case in one single group). From hereon, we refer to these groups as associations.
- a)
We then discard any cluster candidates in associations with extent-selected clusters (545).
- b)
For all other associations (the ones including candidates from the point source catalog only), we identify the primary cluster candidate by comparing their ℒmax values and discard the 1228 nonprimary ones.
After rejecting all candidates in associations with extended clusters or in an association with a higher ℒmax candidate, we are thus left with 8382 cluster candidates.
- a)
In a related step, we remove 16 further candidates that were found to be a duplicate of an existing extent-selected cluster but missed by the shared member analysis, reducing the sample to 8366 cluster candidates. The details and reasons for this are also discussed at the end of Sect. 3.1.2, omitted here for brevity.
Finally, we manually remove 19 sources found to be contaminants due to phantom source detections in the LS DR 10 caused by foreground dust. In these cases, eROMaPPer identified contaminants as apparent galaxies with similar (red) colors and assigns them to a cluster close to the point source. We found these contaminants through a brief visual inspection of the full sample. After removing them, 8347 cluster candidates remain in the final sample.
We thus narrowed down the initial catalog of 1 250 795 X-ray point sources to a sample of 8347 clusters confirmed by eROMaPPer. To compare its properties to those of the extent-selected clusters, we apply a series of the same cuts to the 12 247 sources presented in K24. We rely on their SHARED_MEMBERS parameter for duplicate removal. This results in a subset of 5721 filtered extent-selected clusters.
3.1.2 Identification of duplicates via shared member analysis
A crucial part of identifying clusters is to ensure no single objects appear multiple times (i.e., clusters which eROMaPPer identified for different point sources or even re-identified from the extent-selected source catalog). The source detection algorithm ermldet sometimes divides the extended emission into multiple point or extended source detections (discussed in detail in B24), which can lead to extended sources being classified as multiple point sources. These cases naturally would be included in our sample. Another possibility is the incidence of a point source close to a cluster, which can lead to eROMaPPer identifying the cluster twice. To disentangle these cases, we developed a method to identify duplicates. For this, we use the catalogs of member galaxies that eROMaPPer provides for each cluster, allowing us to find candidates that share the same red-sequence galaxy members with others.
We start with the 13 436 filtered misclassified cluster candidates identified in the previous cleaning steps (Sect. 3.1.1). Of these, 4118 share at least one member with another point source candidate. Additionally, we consider the 12 247 extent-selected clusters and their member galaxies provided in K24 to identify those cluster candidates from our point source catalog that mirror their detection. This can happen if true point sources, such as an AGN, are close to the cluster. Including the extent-selected catalog, we find that in total 9518 of our misclassified cluster candidates share at least one member with another cluster or cluster candidate.
For each candidate, we identify the candidate with which they share the highest number of members and define its highest shared member fraction as
![Mathematical equation: $\[f_{\mathrm{s}, \max }^i:=\max _{i \neq j}\left\{N_{\mathrm{s}}^j\right\} \frac{1}{N_{\mathrm{tot}}^i},\]$](/articles/aa/full_html/2025/09/aa53942-25/aa53942-25-eq5.png) (5)
(5)
where ![Mathematical equation: $\[N_{\mathrm{s}}^{j}\]$](/articles/aa/full_html/2025/09/aa53942-25/aa53942-25-eq6.png) are the shared members of candidate i with candidate j, and
are the shared members of candidate i with candidate j, and ![Mathematical equation: $\[N_{\text {tot }}^{i}\]$](/articles/aa/full_html/2025/09/aa53942-25/aa53942-25-eq7.png) the number of members of candidate i. The distribution of this fraction as a function of redshift among the misclassified cluster candidates is displayed in Fig. 2. The distribution is skewed toward lower redshifts as the area covered in the sky is larger for low-redshift clusters, so true X-ray point sources such as AGN are more likely to be in their vicinity. The distribution of fs,max (projected in the panel on the right) peaks at ~0.97 and displays an additional peak at fs,max = 1, reflecting those cluster candidates that share all of their members with another.
the number of members of candidate i. The distribution of this fraction as a function of redshift among the misclassified cluster candidates is displayed in Fig. 2. The distribution is skewed toward lower redshifts as the area covered in the sky is larger for low-redshift clusters, so true X-ray point sources such as AGN are more likely to be in their vicinity. The distribution of fs,max (projected in the panel on the right) peaks at ~0.97 and displays an additional peak at fs,max = 1, reflecting those cluster candidates that share all of their members with another.
As done by K24, who flagged (and discarded) all extent-selected clusters that shared more than 70% of their members with another extended cluster with higher ℒmax, we apply a threshold at fs,max = 0.7 (indicated by the red dashed line in Fig. 2) to consider a candidate to be part of a shared member-source.
We then group candidates in associations, which are defined by their members being linked by having fs,max > 0.7 with others. A more thorough explanation of this is provided in Appendix B. We distinguish between associations that contain clusters already present in the extent-selected catalog (2148) and ones that only contain candidates identified at the positions of the clusters in the point source catalog (971).
Of the 13 436 misclassified cluster candidates remaining before this step, we in total discard 5054 candidates either sharing high member fractions with close extent-selected clusters or higher ℒmax misclassified cluster candidates. We keep the highest ℒmax candidate for each of the 971 associations without extent-selected clusters. The SPLIT_NEIGHBOR_NUM column of the final catalog denotes the number of other point sources that point toward the same cluster.
After this step, we perform one final cross-match with the K24 extent-selected catalog, finding only 16 candidates that are in the vicinity (both in terms of distance and redshift, see Appendix B for a brief discussion) of extent-selected clusters. This highlights that the shared-member approach is successful in identifying duplicates, and will be adopted for future studies on eRASS:5 data.
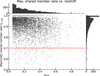 |
Fig. 2 Distribution of the maximally shared member fraction fs,max (Eq. 5) as a function of redshift for 9518 misclassified clusters that share at least one member. fs,max is calculated with respect to the joint member sample of other misclassified clusters and the extent-selected clusters presented by K24. The histograms in the top and right panels show projections of the distributions. The dashed red line indicates the threshold at fs,max = 0.7 that is adopted to mark candidates as part of associations with others. |
Contribution of clusters from eROMaPPer runs using the filter band combinations in the Bands column, as described in Sect. 3.1.3.
3.1.3 Filter band contributions
As presented in K24, eROMaPPer conducted runs using different filter band combinations (grz, griz, grzW1, and grizW1). The final catalog is selected from these runs based on a priority scheme. For low and intermediate redshifts (zλ ≤ 0.8), the grz combination performs best, while for higher redshifts (zλ > 0.8), the grizW1 combination had the best performance. The separate catalogs were merged using a priority scheme (e.g., a source with a cluster identified at zλ ≤ 0.8 would only be taken from the griz run if not available in the grz run). In total, there were six runs, four of them done in the LS DR 10 south area, and two of them (without i-band photometry) in the LS DR 9 north area. The final catalog of misclassified cluster candidates, therefore, consists of sources identified using the combinations shown in Table 1.
3.1.4 Merging the sample with the NWAY single source counterpart catalog
To infer further characteristics of the galaxy clusters identified by eROMaPPer, we consider the LS DR 10 single source counterparts in the optical and infrared (see Sect. 2.4). Such counterparts have been found for ~750 000 eRASS1 X-ray point sources (Salvato 2025) in the LS DR 10 footprint. By merging these to the 8347 eROMaPPer clusters, we find that 8134 have at least one counterpart available. The remaining 213 sources do not have a counterpart since they fall in the northern LS DR 9 region without i-band photometry, for which no NWAY counterpart cross-matching was performed. We keep those in the sample, labeling them as Class 0. For each X-ray source in the point source catalog, NWAY provides a general probability pany that any of the matches within 1′ represent a correct match, and an individual probability pi for each match within that radius. In some cases, this leads to multiple possible counterparts being identified. We discard all higher-order matches beyond the primary one (i.e., the one with the highest pi). Such secondary matches are discarded for 1564 of the counterparts.
3.2 Classification
In this section, we first describe which properties of the cluster candidates are considered for the classification scheme (Sect. 3.2.1) and then describe the classes we derive from those. We provide an overview of redshifts and colors of counterparts.
We adopt a classification scheme reflecting the method established for the X-ray misclassified cluster candidates in the eFEDS field by Salvato et al. (2022) but apply modifications to account for additional information and different data available. Salvato et al. (2022) ranked their misclassified clusters into 5 classes, where Class 1 denoted true X-ray point sources with no cluster association. In their scheme, the classes were defined so that their order roughly reflected the likelihood of the cluster being associated with the X-ray point source emission. Although we follow their general scheme, the modifications we apply lead to some major differences, for example due the shallower X-ray data and varying exposures of eRASS1, the updated version of the LS catalogs, and the different cluster-finding algorithms. In addition, we introduce a distinction based on assessing the Galactic nature of secure counterparts.
3.2.1 Classification parameters
Before introducing the cluster classes, we describe the features we consider for the classification. Abbreviations (which shorten “counterpart” to CTP) of these are used in the decision diagram Fig. 3. The following distinctions are useful for characterizing the nature of the cluster candidates:
Is counterpart information available? As discussed above, there are 213 cluster candidates in the LS DR 9 north region for which no NWAY counterpart information is available at all. This is the CTP Available? decision point in Fig. 3.
Is the X-ray source in range of a HECATE galaxy? The HECATE galaxy catalog2 (Kovlakas et al. 2021) lists nearby (z ≲ 0.047) bright galaxies that might be responsible for the detected X-ray point source emission. We, therefore, introduce the In HECATE Range? decision point in Fig. 3 to distinguish all sources that are inside the area covered by a HECATE galaxy.
Are we certain the counterpart association is secure? For each optical counterpart to an X-ray point source, Salvato (2025) provide a purity value based on the association likelihood pany and the surrounding ℒdet ≥ 8 sources (by tile). We assume the NWAY single source counterpart to be a secure association if the PURITY8 value is above 90 %. Of the 8134 counterparts, 5021 are above this threshold. This is the CTP Secure? decision point in Fig. 3.
Is the counterpart associated with the cluster? If the counterpart is identified as a member of the cluster by eROMaPPer, it is likely that no single AGN is responsible for the X-ray emission, even in the few cases where its redshift estimate is off, see Sect. 3.2.3. We, therefore, use that membership, indicated by the CTP Cluster Member? decision point in Fig. 3.
Is the counterpart Galactic? As described in Sect. 2.4.1, we assign the CTP_IS_GALACTIC flag based on the (Salvato 2025) classification to distinguish between Galactic and extragalactic NWAY counterparts. Counterparts flagged as Galactic are likelier to have wrong redshift measurements as the CIRCLEZ algorithm is not calibrated for those. If these counterparts are securely associated with the X-ray detection, it is likely that any extended X-ray emission from the optically identified cluster is contaminated by the foreground source. A similar thing can happen if the counterpart is within the radius of an object in the HECATE catalog. We bundle this categorization in the CTP Galactic? decision point.
Do counterpart and cluster redshifts match? The photometric redshifts derived via CIRCLEZ come with a probability distribution function that reflects the uncertainties and degeneracies (Saxena et al. 2024). We use this to calculate an associated symmetric 1σzctp error. We flag all counterparts with CTP_FLAG_BEST_Z_UNRELIABLE where this error relative to the redshift is high, i.e., a low precision is evident as σzctp/(1 + zctp) > 0.15. We choose this particular value as estimated redshifts deviating by more than that are conventionally considered catastrophic outliers in the literature. Additionally, we require the photometry of the counterpart to be reliable when no spectroscopic redshift is available. For each counterpart, Salvato (2025) provides a flag that marks whether the nominal depth has been reached in all of the griz bands (IN_ALL_LS10). We both use this flag and enforce a stricter criterion by requiring a minimum signal-to-noise ratio of S/Nmin = 3 in all of the grzW1 filter bands. We define the CTP_FLAG_BAD_PHOTOMETRY as either IN_ALL_LS10 or S/Nmin ≥ 3 not being met in all bands. For all secure counterparts, we thus assume the redshifts of the counterpart and cluster to coincide if the redshift is reliable, the photometry is reliable if no spectroscopic redshift is available, and the criterion
![Mathematical equation: $\[\left|z_{\mathrm{ero}}-z_{\mathrm{ctp}}\right| \leq \sqrt{\sigma_{z_{\mathrm{ero}}}^2+\sigma_{z_{\mathrm{ctp}}}^2+\left(0.15 z_{\mathrm{ero}}\right)^2}\]$](/articles/aa/full_html/2025/09/aa53942-25/aa53942-25-eq8.png) (6)
(6)
is fulfilled. Here, σzero is the error of the eROMaPPer cluster photometric redshift, and the 0.15zero term takes into account the commonly employed outlier boundary. Secure counterparts whose redshift estimate is unreliable (CTP_FLAG_BEST_Z_UNRELIABLE, see above) are considered at different redshifts by default. This is the CTP Redshift Matches Cluster Redshift? decision point.
3.2.2 Cluster class definitions
In the context of this paper, together with a catalog, we provide classifications of clusters based on their optical counterpart properties to identify extreme and interesting clusters and facilitate follow-up studies. A detailed study of the counterpart colors is provided in Sect. 5, and their X-ray properties are presented in Sect. 6. The parameters and decision points described above allow us to define the following cluster classes for any eROMaPPer cluster we associate with an X-ray point source, with examples provided in Fig. 4:
Class 0 contains the 213 cluster candidates for which no NWAY counterpart is available but which still reflect X-ray point sources for which eROMaPPer has identified an optical cluster counterpart in the LS DR 9 north data. Class 0 candidates could thus belong to any of the other classes, but we cannot distinguish them. We leave these in the sample for completeness, but we note that they are not as well characterized as the rest of the sample that contains single-source counterpart information.
Class 1 contains cluster candidates for which the X-ray source is in the range of a HECATE galaxy or for which the secure counterpart association is likely to be Galactic and not identified as a member of a cluster (see also the definition of Class 4). For the point sources of Class 1 clusters, any X-ray emission from the optically identified cluster is, therefore, likely to be contaminated. We provide an example for such a cluster in the upper left corner of Fig. 4, where the optical cluster detection is clearly offset from the Galactic point source detection. The contours show some faint extended emission at the location of the cluster, but that was not enough to warrant a detection. In total, this class contains 291 cluster candidates, of which only 15 are in the range of a HECATE galaxy.
Class 2 is used for cluster candidates for which the NWAY counterpart is securely associated, is extragalactic, is not a member galaxy of the cluster, and has good photometry. In addition to that, it is required to have either a different redshift than the cluster (see Eq. (6)) or an unreliable redshift estimate. The criteria lead to a total of 2698 Class 2 sources, of which 512 have an unreliable redshift estimate or bad photometry with only photometric redshift available. Physically, these objects correspond to X-ray point sources for which the majority of the measured X-ray emission is expected to stem from AGN along the line of sight to the optically identified clusters; there are 2305 sources with a counterpart redshift higher than the cluster, and 390 sources where the counterpart appears to be in the foreground of the cluster. An example of such a cluster is shown in the upper central panel of Fig. 4. Here, the blue counterpart is very close to the peak of the X-ray emission and seems to be behind the cluster given zctp.
Class 3 indicates sources for which the NWAY counterpart is secure, is extragalactic, eROMaPPer has not identified it as a member galaxy of the cluster, and the counterpart redshift and cluster redshift match according to Eq. (6). We find 970 sources that fulfill the criteria for Class 3. These objects are likely to represent AGN that reside in clusters, and the detected X-ray signal might be the cluster’s emission boosted by the point source or the faint extended emission from the ICM gas, dominated by the X-ray emission from the central AGN. An example of such a cluster is shown in the upper right panel of Fig. 4; the counterpart looks similar to one of the Class 2 examples, but its spectroscopic redshift pinpoints it to be part of the cluster.
Class 4 represents sources for which the NWAY counterpart is secure and is a member of the cluster as assigned by eROMaPPer, and the colors of the counterpart are consistent with an early-type red galaxy (see the details in Sect. 5.2). We find a total of 1073 sources fulfilling these criteria. We expect the sources in this class to be galaxy clusters, which might be more compact than the extent-selected ones, usually having a cool core. An example of such a cluster is shown in the lower left panel of Fig. 4. There is clearly no AGN candidate that could be attributed to the emission, and NWAY selects a member of the cluster to be the most likely single-source association. We decided to prioritize the membership decision point both over the Galactic/extragalactic and the matching redshift criteria after realizing in visual inspection that those clusters are a better fit for this class than Class 1 or Class 2. We note that there are 12 counterparts classified as Galactic that have also been identified as cluster members. We include these in Class 4 after a visual inspection showed that their Galactic classification might be inaccurate. In addition, there are 188 counterparts that seemingly conflict with the cluster redshift estimate, although they are found to be members. We discuss the latter cases in Sect. 3.2.3.
Class 5 represents sources for which no reliable NWAY counterpart to the X-ray point source could be identified. For sources in Class 5, the measured X-ray flux likely stems from the clusters. We find a total of 3102 clusters in this class. These clusters have been misclassified in part due to having emission comparable to the PSF of eROSITA, in part due to having another point source close by, and in part due to the nature of the ℒext = 3 cut. The latter might be the case for the example shown in Fig. 4. Close to the reported coordinates of the X-ray emission, there seems to be no single source that could account for it, so NWAY assigns the closest (faint) galaxy with pany ≈ 0. The cluster is slightly offset.
We have provided an overview of how each class is derived decision-wise in Fig. 3. About one half of the identified cluster candidates lack a secure AGN counterpart (Class 4 or Class 5). Most of the other optically identified galaxy clusters seem to be in the vicinity of the projection of an AGN (Class 3 and Class 4). Only a small proportion of our sources seem to have securely Galactic counterparts or are in the range of a HECATE galaxy (Class 1), or are lacking counterpart information (Class 0).
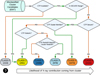 |
Fig. 3 Illustration of the classification process for the cluster classes introduced in Sect. 3.2.2. We abbreviated the counterpart associated via NWAY to CTP for better readability. The decision points are described in detail in Sect. 3.2.1. The numbers in parentheses denote the number of candidates. About one third of the clusters belong to Class 2, where an AGN is located in projection to the cluster. The clusters hosting bright AGN are categorized in Class 3. Misclassified clusters without apparent AGN contribution (Class 4 and Class 5) comprise about one half of the sample, and Galactic contaminants (Class 1) and those sources without counterpart information (Class 0) contribute only a small part. |
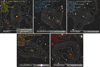 |
Fig. 4 Example LS DR 10 grz images with overlaid X-ray contours for one misclassified cluster candidate of each Class. The green dashed circle marks the location of the X-ray detection’s most likely single-source counterpart determined via NWAY. The important parameters of cluster and counterpart association are annotated. Upper left: Class 1 cluster. Here the X-ray point source is clearly associated with the star, while eROMaPPer identified a nearby cluster in the lower left quadrant, where we marked the BCG to highlight the location of the cluster. Upper center: Class 2 cluster with an AGN clearly associated with the X-ray emission. The foreground cluster emission might contribute partially, as seen by the elongated shape. Upper right: Class 3 cluster with an AGN located at the same redshift z ~ 0.48. The contours resemble those of a point source, with the AGN likely outshining any ICM emission. Lower left: Class 4 cluster, for which the most likely single counterpart is an early-type galaxy that is identified as a member. There is no AGN discernible, and the contours are a little more extended. Lower right: Class 5 cluster, for which the NWAY counterpart is not secure (pany ≈ 0). The X-ray contours have a more extended appearance than the point source of the Class 3 cluster, for example. North is up; east is left, and the images are centered around the initial X-ray point source detections. |
3.2.3 Counterpart redshifts
Since the redshifts of the counterparts are a vital part of the classification, we provide a comparison to the cluster redshifts here. More details on the cluster redshifts are discussed in Sect. 5.1; we are using the best redshift estimate zero. As described in Sect. 2.4.2, the best counterpart redshift zctp is spectroscopic if available, and photometric determined by CIRCLEZ otherwise. The CIRCLEZ photometric redshifts are associated with realistic errors, which can be high in a relative sense. The relation of zctp to zero is shown in Fig. 5 for classes 2 to 5, as Class 0 clusters do not have NWAY counterparts, and Class 1 clusters have counterparts that are likely to be Galactic, which results in flawed redshift estimates.
For Class 2 (upper left panel in Fig. 5), the counterpart redshifts are, by construction, offset from the eROMaPPer redshifts. There are almost no counterparts where zctp ≈ zero; if they are, it is due to the counterpart being associated with bad photometry or an unreliable redshift estimate (CTP_FLAG_BEST_Z_UNRELIABLE, see Sect. 3.2.1). The counterpart redshifts follow no clear trend, having a median at a higher redshift than any of the other classes and being usually associated with high uncertainties. There are more clusters with counterparts at higher redshifts (in total 2305), while 390 are associated with counterparts at lower redshifts.
For Class 3, the counterpart redshifts by construction are close to the cluster redshifts, with deviations only due to the uncertainties in zctp. This is shown in the upper right panel of Fig. 5. The 1σ error bars shown indicate that some Class 3 clusters should be expected to belong to Class 2; without spectroscopic redshift information of the counterparts, it is currently not possible to disentangle these cases.
For Class 4, the correlation of counterpart and cluster redshifts is generally tight (see lower left panel on Fig. 5). This confirms our method of selecting these clusters via their counterparts’ membership assignment through eROMaPPer, as the counterpart spectroscopic and photometric redshift estimates agree independently. There are a few estimates that disagree. We find moderate offset (i.e., zdiff := |Δz|/(1 + zero) > 0.05) for 188 clusters, and stark disagreement (zdiff > 0.15) for 20 of those. There are two explanations for these disagreements: Either the CIRCLEZ photometric redshift estimate of the counterpart is uncertain (with zctp mostly being in agreement with zero within the 1σ uncertainty estimate, indicated by the gray uncertainty bars in Fig. 5), or the NWAY counterpart that eROMaPPer has identified as a member galaxy is not a true member galaxy. We visually inspected the 20 clusters with stark disagreement to disentangle these cases. For most of them, the former seems to be the reason.
In Class 4, we find two cases for which the eROMaPPer membership association has an issue. In the first case, an AGN (1eRASS J123745.1+240542) at zctp = 0.716 is incorrectly identified as a member of a zero = 0.450 cluster, most likely due to high uncertainties in the photometry. Therefore, this cluster should instead be categorized as Class 2. In the second case (1eRASS J020705.3-272657), eR0MaPPer adopted the spectroscopic redshift of the central galaxy (in this case coinciding with the BCG) at zspec,cg = 1.00. In contrast, its photometric redshift of zλ = 0.365 is consistent with zctp = 0.32 ± 0.05. zspec,cg does not correspond to the BCG but to a gravitationally lensed background quasar whose arc surrounding the BCG is visible. Other than for those outliers, we find that the photometric redshift estimation with CIRCLEZ seems to be precise for most elliptical galaxies. All of the 12 Class 4 clusters with counterparts classified as Galactic still have a counterpart redshift assigned that matches the cluster’s redshift.
For Class 5 (lower right panel of Fig. 5), 25 Class 5 sources with no counterpart redshift estimate are not shown. For many of those where it is available, zctp and zero seem to agree. This is surprising, as the counterpart found by NWAY has a very low association probability with the X-ray source and could therefore have a random redshift. Their agreement (and later also the counterpart’s colors, see Sect. 5.2) indicates that many of the sources identified as the low-probability counterpart are galaxies belonging to the cluster, not unlike Class 4 clusters. This is reflected by the fact that for 1111 of the 3102 Class 5 clusters, the most likely counterpart from which zctp is taken is considered by eROMaPPer to be a member of the cluster.
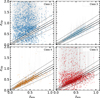 |
Fig. 5 Relation between the most likely counterpart best redshifts zctp and the corresponding eROMaPPer cluster redshifts zero, split by cluster class. The 1σ error bars corresponding to these best redshifts are indicated in gray. The black lines show zctp = zero ± m(1 + zero) with m = 0 for the straight, m = 0.05 for the dashed lines, and m = 0.15 for the dotted lines. Since photometric redshift estimates for Galactic counterparts are unreliable, we do not show Class 1. |
4 Cross-matching with public cluster catalogs
The clusters of galaxies detected in the point source catalog carry significant implications for understanding the selection effects and the completeness of the extent-selected samples compiled from the same data. The cross-matches with public optically, X-ray-, and SZ-selected clusters help to evaluate the cluster populations these surveys detect. This section provides counterparts of eRASS1 clusters in the point source catalog to those found in several previously published cluster catalogs compiled from optical, X-ray, and SZ surveys. A compilation of cross-matches with these surveys, their median redshift, and offset distributions is shown in Table 2. We use a matching radius of 2′ applied to the eRASS1 for a fair comparison. The identifiers of the matched clusters are given in the catalog under the column MATCH_NAMES. Out of the 8347 clusters of galaxies detected in this sample, we find that 2528 have known counterparts, suggesting a 70% discovery rate. This percentage falls below the rate of the extent-selected sample with the reported rate of 80% (see B24, for details). Fig. 6 shows the redshift distributions of cross-matched clusters of selected cluster samples.
4.1 Comparison with optically selected cluster samples
An introduction to the optical catalogs we used for cross-matching can be found in Appendix C.1. As the Abell catalogs mainly consist of nearby clusters, they are expected to have a higher matched rate with the extent-selected sample, and indeed, many cross-matches (152) have already been identified in the catalog of B24; K24. In this work, we match another 23 at a median redshift of 0.1; we note that some are not recovered due to the z ≥ 0.05 cut applied to our sample.
The cluster catalogs based on DES-Y1 data are compiled through the redMaPPer algorithm, and have 664 close associations in our catalog, a number comparable to the extent-selected sample. The median sample redshift of 0.42 and a median separation of ![Mathematical equation: $\[28^{\prime \prime}_\cdot 9\]$](/articles/aa/full_html/2025/09/aa53942-25/aa53942-25-eq9.png) are larger than the extent-selected sample reported in Bulbul et al. (2024). We find 82 close matches clusters with the surveys dedicated to finding clusters at high redshifts (z > 0.8; e.g., MaDCoWS (Gonzalez et al. 2019), NEURALENS (Huang et al. 2021), GOGREEN-GCLASS (Balogh et al. 2021), and WENHAN-HIGHZ-SPECZ (Wen & Han 2018)). The shallow depth of the WISE data included in the LS DR 10 survey makes the confirmation challenging in our catalogs; however, we still identify the most massive of these high-redshift clusters in our sample at z > 0.5.
are larger than the extent-selected sample reported in Bulbul et al. (2024). We find 82 close matches clusters with the surveys dedicated to finding clusters at high redshifts (z > 0.8; e.g., MaDCoWS (Gonzalez et al. 2019), NEURALENS (Huang et al. 2021), GOGREEN-GCLASS (Balogh et al. 2021), and WENHAN-HIGHZ-SPECZ (Wen & Han 2018)). The shallow depth of the WISE data included in the LS DR 10 survey makes the confirmation challenging in our catalogs; however, we still identify the most massive of these high-redshift clusters in our sample at z > 0.5.
In general, the number of cross-matched cluster candidates to the optical samples is as large as for the extent-selected clusters, with a redshift distribution skewed to marginally higher values. We observe a slightly larger median offset in this sample. This may be attributed to the fact that our clusters are either below the flux limit or dominated by X-ray emission from a point source. As a result, the X-ray centroids of these clusters are less accurately determined than those in the extent-selected source catalog.
Public cluster catalogs cross-matched with clusters in the eRASS1 misclassified cluster catalog of this work.
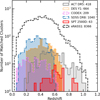 |
Fig. 6 Redshift histogram of the eRASS1 misclassified clusters that have matches in the ACT DR5, DES Y1, CODEX, SDSS DR8, and SPT 2500D Surveys, and the redshift histogram (zbest) of all misclassified clusters. The largest overlap of clusters is between the optically selected samples and eROSITA. |
4.2 Comparison with X-ray catalogs
The galaxy clusters presented in this work have a compact appearance consistent with the ~30″ survey-averaged PSF of eROSITA, leading to their misclassification as point sources. As pointed out for deeper eFEDS observations by Bulbul et al. (2022) and Salvato et al. (2022), some of these clusters are likely to be below the flux limit of the shallow eRASS1 survey. They may be detected in the point source catalog because an AGN boosts their flux along the line of sight or in the cluster itself. Another possible reason for misclassification could be the bright, cool cores of compact, low-redshift groups or high-redshift clusters for which the faint, extended X-ray emission from the outskirts is too faint in contrast to the central emission such that the detection as an extended source is not possible at the shallow depth of eRASS1. Our optical identification method, which is not biased by the contamination of AGN flux, can identify the red galaxy members of the clusters in the point source catalog if they fall above the optical cut applied to the sample (see Sect. 3.2 for details). In the common footprints, deep X-ray surveys with better PSFs, for example Chandra and XMM-Newton, may detect these clusters. We, therefore, cross-matched our sample with X-ray catalogs in the literature.
An introduction to the public catalogs we compare to, such as the ROSAT-based MCXC, CODEX, and eMACS catalogs, and the XMM-Newton-based XXL, XCS, and X-Class surveys, as well as an introduction to clusters in the eFEDS field, can be found in Appendix C.2.
Because of their extended nature, most of the clusters within the MCXC catalog are already detected in the extent-selected eRASS1 cluster catalog. Still, we find an additional 39 clusters with a median redshift of 0.27, a higher redshift than the cross-matched sample with extent-selected clusters with a similar median offset value. Within the CODEX catalog, we find 209 common clusters at higher redshifts in this sample with a median redshift of z = 0.33; similarly, in this case, most of the extended sources are already matched to the extent-selected eROSITA samples. The eMACS catalog only has four cross-matches in our sample. We further investigated this, as one would expect to recover these highly X-ray luminous clusters. We find 27 to be matched in the extent-selected eRASS1 catalog, so in the common footprint, seven are not recovered by either the extent-selected catalog or our selection. We find that three of those are filtered due to our ℒmax cut, and the remaining four were removed due to the IN_ZVLIM cut.
For the eFEDS field, (Salvato et al. 2022) classified point sources that were also cluster candidates in a scheme of four cluster classes (Class 2 to Class 5), which we roughly adopted for this work. When cross-matching our point source sample to the two eFEDS catalogs, we find 54 matches to their extent-selected catalog, and 19 matches to their point source catalog, of which 2 also have a closer match to an extent-selected cluster.
The large median offset of ~54″ between the 19 cross-matched misclassified clusters in eFEDS and eRASS1 is likely due to low photon statistics of the eRASS1 sources, projected fainter AGN or cool-core cluster emission being missed, or AGN variability. Visual inspection of the 11 matches for which the offset is ≳50″ was not sufficient to distinguish between those cases. Since the underlying X-ray point sources are so far apart, the inferred cluster classes also do not match for 7 of them, although we note that this can also be caused by the difference in methodology. For the 8 close matches, the cluster classes do not match in only 2 cases, which can both be explained by the shallower photometry used (LS DR 10) for this work. Another difference is the availability of the deep Hyper Suprime Cam Subaru Strategic program (HSC; Aihara et al. 2018) data for eFEDS, enabling more secure identification of faint counterparts. We further discuss the recovery of eFEDS sources with respect to their X-ray luminosities in detail in Sect. 6.2.
The offset observed between X-ray centroids is generally small between matched samples in the X-ray surveys (with the eMACS survey being an exception, which, however, only contains four matches). This is mainly due to localization accuracy and the small PSF of the X-ray telescopes, which can measure the centroid of the ICM gas accurately.
4.3 Comparison with SZ catalogs
The surveys based on the Sunyaev–Zeldovich (SZ) effect are yet another efficient way of detecting clean and complete samples of clusters of galaxies. Prominent cluster surveys are constructed with data from the Atacama Cosmology Telescope (ACT), the Planck Satellite, and the South Pole Telescope (SPT).
The most extensive SZ-selected cluster catalog to date is based on Planck’s final All-Sky survey, which consists of 1653 sources (Planck Collaboration XXVII 2016). In the common footprint of 10 281 deg2, we identify ten counterparts in our catalog with a median sample redshift of 0.42. Planck detected clusters show the largest offset of 78″ with the counterparts compared to other surveys cross-matched with eRASS1 catalogs; this is most likely due to the large beam size (8.76′ at 100 GHz Planck Collaboration XXIX 2014).
The SPT has performed several deep surveys in the Southern Hemisphere since its start of operations in 2007. The first SPT survey, SPT-SZ hereafter, covering a region of 2500 deg2, has 66 identified counterparts in our sample with a median redshift of 0.60, a redshift much higher than counterparts in the extent-selected sample (Bleem et al. 2015; Bocquet et al. 2019). Deeper surveys were performed with an upgraded SPT-pol receiver (SPT-Pol 100 deg2) and SPT-pol Extended Cluster Survey (SPT-ECS) covering a 100 deg2 and 2700 deg2 areas contains 13 and 36 common clusters with mean redshifts between 0.46 and 0.6 and centroid offsets between ~32″ (Huang et al. 2020; Bleem et al. 2020).
The ACT DR5 catalog is based on a survey performed between 2008 and 2018 in a 13 211 deg2 region in the Equatorial region and Southern Hemisphere (Hilton et al. 2021). The wider survey area compared to SPT surveys combined with ACT’s smaller beam size led to a large number of matches with both the extent-selected and our catalog. We find 418 common clusters in the overlapping footprints with a sample’s median redshift (zmed = 0.55) and centroid shift of 31.9″, consistent with our PSF size.
5 Optical properties of the sample
The primary and cosmology cluster samples presented in B24 are strictly selected based on their X-ray properties, i.e., the measured extent likelihood parameter in the detection chain. The optical identification and confirmation of these samples have minimal influence on the completeness as the richness limit, applied in the confirmation process, is as low as three (for further details see K24). However, although the cluster sample examined in this work is selected via X-ray detection, the optical identification through the eROMaPPer tool plays a more critical role. As the extent likelihood does not play a significant role in the selection of this sample, the contamination rate is expected to be higher than the extent-selected sample. While we have aimed to reduce optical contaminants as much as possible by employing the various cuts presented in Sect. 3.1.1, it is useful to study the multi-wavelength properties of this sample and compare them with the extent-selected sample. This section examines the redshift and color distributions of each Class as grouped in the previous section.
Redshift types available for clusters in the misclassified cluster catalog. The first column shows the priority assigned, while the Available column denotes how many redshifts are available with the given redshift type, and the Best column reflects how many of these were used for the best redshift estimate.
5.1 Redshifts and richness distribution of clusters
In this work, each misclassified cluster candidate is assigned at least one redshift estimate by eROMaPPer. In short, a photometric redshift estimate zλ reliant on the member photometry is calculated for all clusters. Clusters where a spectroscopic redshift is available for the galaxy located at the optical center of the cluster are assigned this redshift as zspec,cg. A bootstrapped bi-weight redshift estimate is calculated for clusters with at least 3 members having spectroscopic redshift. The final best redshift zero is assigned based on a priority scheme, where zspec is used unless the final velocity clipping during its calculation doesn’t converge (which is the case for 83 clusters). We note that we deviate from the K24 notation of zbest. We denote the cluster redshift by zero (as it is determined by eROMaPPer) instead to better distinguish it from the redshift of the optical counterpart, zctp. Due to our selection process, we do not include any literature clusters outside the LS DR 10 footprint cross-matched with the X-ray point source catalog. Hence, there are no clusters with only a literature redshift zlit available. The final redshift types are summarized in Table 3. We present the distribution of these best redshift estimates for all 8347 cluster candidates, subdivided by their class in Fig. 7. We also show the distribution of the 5721 extent-selected clusters that were subject to the same cuts as our sample (see Sect. 3.1.1).
The 291 Class 1 cluster redshifts follow a flat distribution with no significant features, as might be expected of chance optical cluster detections close to Galactic sources. For all distributions, notable differences from the extent-selected distribution are the generally higher median values. These are expected especially for the clusters in Class 2 and Class 3, as the compact X-ray emission of the AGN would boost the X-ray emission of the clusters at higher redshift whose extended emission by itself falls below the detection limit. The median for Class 4 is remarkably close to the extent-selected sample, although the peak around the median is not as pronounced. The distribution of Class 5 also appears to be skewed toward higher redshifts. We anticipate detecting high-redshift cool core clusters that are missed by the extent-based selection, resulting in a sample that is skewed toward higher redshifts. This is also reflected in the higher median redshifts of the cross-matched samples with other multi-wavelength surveys presented in Sect. 4.
A comparison of the richness distribution of the misclassified clusters in this sample to that of the 5721 filtered eRASS1 extent-selected sample is provided in Fig. 8. We do not distinguish between the different cluster classes as the distributions are similar. We note that the ℒmax cut performed in Sect. 3.1.1 removed mainly low-richness clusters; without this cut, the distribution would peak at the minimum richness of λnorm,min = 16. The distribution is skewed toward a lower median value (med(λnorm,PS) = 28.4 and med (λnorm,EXT) = 38.8) with a smaller tail. This is not surprising as clusters with higher richness values are expected to be brighter in the X-rays and thus less likely to have their extended ICM emission confused as a point source. The skewed richness distribution toward low richness indicates that this sample includes faint clusters that fall below the survey’s flux limit.
 |
Fig. 7 Distribution of the best redshifts zero assigned by eROMaPPer to the misclassified clusters, split by cluster class for the different panels, displayed in their respective colors. The upper left panel shows the distribution of the full sample combining all classes. The distribution of 5721 extent-selected clusters (B24), filtered the same way as the point source candidates, are displayed in the background in gray to guide the eye. The median of each distribution is indicated by a dashed line. |
5.2 Color distribution of the NWAY counterparts
Color–color diagrams are widely used in the literature to characterize the nature of the detected sources (e.g., Ruiz et al. 2018; Salvato et al. 2022). We present the position of all NWAY counterparts in the g − r and z − W1 color-color plane of the sample of all clusters with counterparts available in Fig. 9, leftmost top panel. The same figure also presents the color-color diagrams of the sample split by the Class information. The empirical distinction line distinguishing the Galactic sources from the extragalactic is used to position the counterpart in the color-color plane Salvato et al. (2022); Salvato (2025), also shown in Fig. 9 with a dashed line. The distinguishing line is defined as
![Mathematical equation: $\[z-W 1=0.8~(g-r)+1.2.\]$](/articles/aa/full_html/2025/09/aa53942-25/aa53942-25-eq10.png) (7)
(7)
The top left panel of Fig. 9, showing the color properties of the full sample, clearly shows that this diverse sample is composed of clusters with Galactic and extragalactic counterparts assigned by NWAY. Due to their Galactic nature, most of the counterparts in Class 1 clusters shown in the top-middle panel are below the Galactic source distinguishing line, as expected. Therefore, they are not considered for further sample investigation. There are a few Class 1 sources that are located above the distinction line. This is either due to the counterpart being associated with Gaia motions, having partially saturated photometry, or being in the range of a HECATE galaxy. The distribution of the counterparts of Class 2 clusters shows an apparent concentration in the upper left of the panel, displaying colors typical of AGN (e.g., Salvato et al. 2022). While not as pronounced, the counterparts of Class 3 clusters are also found in this locus. This is expected as the Class 3 is designed to locate the clusters hosting bright AGN in their center. The colors of the counterparts in Class 4 are consistent with the early-type galaxies (ETG), which evolve with redshift as different spectral features enter the grzW1 filter bands. Notably, while Class 5 counterparts (which, by design, are only weakly associated with the X-ray point source emission) cover all areas covered by counterparts of the other classes, there is a noticeable overdensity in the locus of ETGs similarly to the Class 4 counterparts. This indicates that for many of these, the weakly associated counterpart is an ETG, which is reflected by 1111 of the 3102 Class 5 clusters with counterparts that are associated as member galaxies by eROMaPPer. The color-color diagrams confirm that the detailed classification scheme in Sect. 3.2 works well.
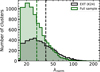 |
Fig. 8 Distribution of the normalized richness estimate λnorm Eq. (3) assigned by eROMaPPer. The bins are equidistant, while the x-axis is displayed logarithmically. The distribution of 5721 extent-selected clusters (K24), filtered in the same way as the misclassified clusters, is displayed in the background to guide the eye. A dashed line indicates the median of each distribution. We do not split the sample by Class here as the distributions are similar. |
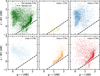 |
Fig. 9 Distribution of the LS DR 10 colors derived from the grzW1 dereddened AB magnitudes of the counterparts, first for the full sample in the upper left panel, followed by counterparts to the different cluster class objects. We show the empirical distinction line (Eq. (7)) to distinguish between Galactic and extragalactic sources. |
6 X-ray properties of the sample
To be able to characterize the properties of the sample better and understand the selection of this sample; we employ a reprocessing of the eROSITA data similar to the extent-selected sample to derive the X-ray properties of the cluster candidates. For this, we perform MultiBand Projector 2D (MBProj2D, Sanders et al. 2018) X-ray imaging analysis using the eRASS1 data as described in Liu et al. (2023); Bulbul et al. (2022, B24). MBProj2D forward fits the X-ray images of a cluster to obtain its physical models, such as the electron density profile and temperature profile. In this work, we fit the image in the soft band (0.2 to 2.3 keV) where eROSITA has the highest sensitivity, as most of the clusters in our sample are too faint to be detected in the hard band. During the fit, the cluster center can vary the reported coordinates (RA, Dec) in the catalog within a radius of 12″, which accounts for the positional accuracy of the point source detection. In contrast, in the analyses of the extended sources, the centroid of the X-ray emission was allowed to vary. Due to this limitation, the offset from the initially reported X-ray position is generally smaller than for the extent-selected sample (see Fig. 10 in B24).
For each cluster, we create an image and exposure map using the eROSITA Science Analysis Software System (eSASS, version c020; Brunner et al. 2022). The electron density profile is described as a simplified version of the Vikhlinin et al. (2006) model:
![Mathematical equation: $\[n_{\mathrm{p}} n_{\mathrm{e}}=n_0^2 \cdot \frac{\left(r / r_c\right)^{-\alpha}}{\left(1+r^2 / r_c^2\right)^{3 \beta-\alpha / 2}}.\]$](/articles/aa/full_html/2025/09/aa53942-25/aa53942-25-eq11.png) (8)
(8)
Here ne and np are electron density and proton density, and we assume ne = 1.21np (Bulbul et al. 2010). The central number density (n0), core radius (rc), and the slope of the surface brightness in the core (α), a crucial parameter in the model, as the clusters in this sample are expected to have a peaked surface brightness profiles, and the slope of the profile at large radii (β) are free parameters in the model. We do not include the largescale components of the model in our fit because all the clusters in our sample have very small angular sizes. The detailed 2D image fitting about the MBProj2D can be found in Appendix A of B24. The Galactic absorption nH is fixed to the values obtained from the HI4PI survey (HI4PI Collaboration 2016). We assume the temperature is isothermal and remains constant throughout the cluster. Metal abundance is fixed at 0.3Asun as it is hard to measure in the photon-limited number survey depths (Asplund et al. 2009). C-stat is used as an estimator for the goodness-of-fit to avoid any biases on the best-fit parameters, similar to the extent-selected sample. The physical properties of the clusters are derived at the redshifts computed by eROMaPPer.
In this section, we compare the X-ray properties, such as the distance of the X-ray centroid of the BCG, luminosity, and number density of the clusters mischaracterized in the point source sample with the extent-selected sample to understand better the reasons for the X-ray selection process and improve it for the deeper eROSITA surveys.
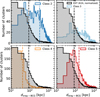 |
Fig. 10 Distribution of the offsets of the fitted MBProj2D X-ray centroid and the optical eROMaPPer BCG coordinates, split by cluster class. The distribution for the 5721 filtered extent-selected clusters is shown in black, normalized for better visibility. The median offsets are indicated by the dashed lines. Compared to the median offset of ~86 kpc found for the filtered extent-selected sample, the offsets are generally higher for Class 2, Class 3, and Class 5 and are much lower than for Class 4. While large offsets can hint at mergers for extent-selected clusters, for the point source sample, they are more likely to indicate a chance projection of the cluster and the real point source along the line of sight. |
6.1 X-ray centroid to BCG distance
The offset between the fitted X-ray center, an output by MBProj2D, and the BCG can be used as an indicator of the dynamical state of a cluster (e.g., Zenteno et al. 2020). In the case of our sample, a large offset between the peak of the X-ray emission and the BCG can also be caused by the associated AGN being brighter in the X-rays than the extended emission of the cluster. The BCG is chosen by eROMaPPer as the brightest member galaxy in the z band, which up to ~20% can result in an incorrect choice of the BCG, for example, due to the true BCG being missed because of star-formation, dust absorption, masking, or unreliable photometric measurements caused by the BCG’s extended outer component. The distance between the X-ray centroid and the BCG position dX–ray–BCG is presented in Fig. 10. We compare those distances of classes 2 to 5 to the normalized distribution of the 5721 filtered extent-selected clusters, which have a median of ~86 kpc. We omit Class 1 as for these clusters, the Galactic or nearby galaxy’s X-ray emission is likely to have driven the detection, leading to large offsets.
The offset distribution of the full sample is large, with a median of ~214 kpc and an extended tail. We further examine the distribution by the cluster Class to understand several observed trends. For Class 2 clusters, the X-ray point source emission is associated with an AGN in projection to the optical cluster. Since their position on the sky should not correlate with the cluster, some offset is expected, although especially low-richness clusters with a high offset are removed by the ℒmax cut. This explains the observed median offset of ~328 kpc. Interestingly, around 11% of the Class 2 BCGs have dX–ray–BCG ≲ 86 kpc. A brief visual inspection reveals that there is a chance projection of the BCG close to an AGN for around one half of those. For the other half, the NWAY counterpart seems to be either a galaxy at a different redshift than the cluster (indicating that the reported flux might stem from the cluster) or a faint object with unreliable photometry. Due to the 90% purity cut adopted to discern secure counterparts, a few contaminants are not surprising.
The offset distribution for Class 3 clusters, shown on the top right panel of Fig. 10, appears rather flat with a high median of ~324 kpc. This can be explained by multiple effects influencing dX–ray–BCG for these objects: the largest distances can stem from the AGN being in the outskirts of the clusters, outshining the ICM. Some might only be projected AGN since the photometric redshift estimate of the counterpart can be associated with large errors. Another reason for large offsets is misidentified BCGs, which can occur due to the true BCG not being recognized as a member. This is most prominently the case for the Phoenix cluster (see Fig. 11), for which the true BCG is not identified as a member due to its blue colors, hence leading to a reported BCG at ~870 kpc away from the center. There are also some Class 3 clusters with low offsets. As for Class 2, the reason for those can either be that the brightest member galaxy happens to be close to the galaxy hosting the AGN (which might be the true BCG missed due to the color offset by the AGN) or, in a few cases, nearby counterparts with unreliable photometry.
The low observed concentration of dX–ray–BCG (with the median of ~41 kpc being even below that of the filtered extent-selected sample) is expected for clusters in Class 4. In this subcategory of clusters, no AGN is found close to the reported X-ray point source emission, and the NWAY counterpart is already a cluster member, implying that it has to be in close positional proximity. Indeed, 572 of the 1073 counterparts coincide with the BCG. For Class 5 clusters, the distribution of dX–ray–BCG peaks at a distance of ~100 kpc as those objects with a BCG very close to the point source emission are expected to have the BCG recognized as a likely counterpart by NWAY, in which case they are included in Class 4. Indeed, we find the combined distribution of Class 4 and Class 5 clusters to be closer to that of the filtered extent-selected sample, albeit with a more pronounced tail toward higher offsets. Unlike for Class 2 or Class 3, very large offsets for Class 5 are likely to indicate a disturbed dynamical state.
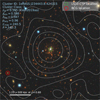 |
Fig. 11 LS DR 10 grz image of 1eRASS J234443.8-424315 overlaid with eRASS1 X-ray contours. This object, also known as the Phoenix cluster (McDonald et al. 2012), is one of the most X-ray luminous clusters and is infamous for being misclassified as a point source due to the bright AGN hosted by the BCG. It is identified as the most likely NWAY counterpart (light green circle), while the BCG reported by the eROMaPPer algorithm (red circle) is offset by ~870 kpc because the true BCG’s colors are too far from the red sequence. North is up; east is left, and the image is centered around the initial point source detection. |
6.2 X-ray luminosity measurements
Similar to the analysis for the extent-selected clusters, we measured the X-ray luminosity of the misclassified clusters within 300 kpc. A first approximation of R500 to estimate the MBProj2D image size was obtained by using the best-fit luminosity-mass scaling relations of the extent-selected eFEDS sample (Chiu et al. 2022)3. For a fair comparison, the same process was employed as in the analysis of the extent-selected sample. In a later step, an improved estimate of the cluster’s luminosity L500, and R500 was determined by inferring the intrinsic count rate of the clusters via background modeling plus Galactic column density (NH) and K-factor corrections. As cautioned by B24, the X-ray photon counts are limited due to the shallow nature of the eRASS1 survey. In the case of the sample presented here, they are typically even lower. Therefore, we cannot explore the trends between various subcategories. In the catalog, we provide a measurement of L300 for clusters in Class 3, 4, 5 with significant detection 2σ confidence level within 300 kpc. Such measurements are available for 401 Class 3,384 Class 4, and 800Class 5 clusters. They are biased toward the more luminous sources, as the shallow nature of eRASS1 complicates reliable flux measurements, especially for the fainter sources.
To compare the X-ray luminosity distribution with respect to redshift with the previously published eROSITA catalogs for all 888 cross-matched eFEDS sources in Fig. 12 are shown in filled circles and crosses. The redshifts and luminosities are adopted from Liu et al. (2022) and Bahar et al. (2022) for the 542 extent-selected clusters and from Bulbul et al. (2022) for the 346 clusters at point source positions. Sources that match the extent-selected catalog are marked by small red circles, and small yellow crosses mark sources that match the catalog presented in this paper. Since eRASS1 is approximately ten times shallower than the eFEDS area (average flux limit of ~10−13 erg s−1 cm−2), many extent-selected sources from eFEDS are not detected. This is expected and accounted for by the selection function (see Clerc et al. 2024, for comparisons of the selection function); therefore, it does not influence the science analysis of the extent-selected sample (e.g., cosmological constraints). Nonetheless, most clusters above the flux limit of the eRASS1 cluster survey are detected, shown in the black dashed line. Of the 888 clusters, the 113 eFEDS clusters above the flux limit of the eRASS cluster survey, 70 are detected in the eRASS1 extent-selected sample and this sample. Of the remaining 43 clusters, all but 7 can be found in the full eROMaPPer catalog on all eRASS1 point sources; they are removed due to the filtering adopted in this work.
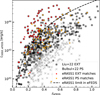 |
Fig. 12 X-ray luminosity-redshift distribution for the 888 clusters reported in the eFEDS field. The 346 extent-selected eFEDS clusters Liu et al. (2022); Bahar et al. (2022) are denoted by gray circles, and the 542 clusters at positions of eFEDS point sources by gray crosses. Sources with matches to the eRASS1 extent-selected catalog (B24) are marked by small red circles, and small yellow crosses mark sources with matches to the catalog presented in this paper. The average eRASS1 flux limit of ~sim 10−13 erg s−1 cm−2 in the eFEDS field is indicated by the black dashed line. Most extent-selected eFEDS clusters above the flux limit are recovered, even though 54 of the 117 total matches to extent-selected eFEDS clusters are found as a point source in the eRASS1 catalogs. |
6.3 Electron number density distribution
The electron number density profiles of the clusters in this sample with significant (2σ) luminosity detection are shown in Fig. 13, with respect to cluster class. We show the median profile and 16th and 84th percentiles for each subsample and compare it to that of the extent-selected sample of B24 shown in dashed lines. Qualitatively, the median profiles of clusters in Class 2 and 3 appear to be very similar, being cuspy with high central densities and a comparatively low extent compared to the extent-selected sample. At the same time, the X-ray emission of the Class 2 and 3 candidates is most likely contaminated by the flux of the point source if it is near the cluster core defined by the X-ray detection, as the core region is not excised in this work. The clusters in these classes are likely underluminous, and their flux is below the flux limit to be detected as extended emission in the shallow first All-Sky Survey; however, they are detected in the point source catalog due to the AGN emission at the same redshift or in projection. A small fraction of the Class 2 and 3 profiles are more extended than those of the extent-selected sample. We expect these are not recognized as extended due to being too faint compared to the nearby point source.
The median profiles of clusters in Class 4 and 5 resemble the median profile of the extent-selected sample; while being flatter and more extended than the ones for Class 2 and 3, they still show an excess in the core in comparison to median extent-selected one, likely due to cool cores. The similarity indicates that this subset includes a population of clusters similar to the extent-selected ones. Especially the clusters in Class 4 are likely to be clusters given their low X-ray to BCG offsets discussed in Sect. 6.1; the detection algorithm ermldet detects the core of these clusters as a point source as the emission from the outskirts is faint. These clusters are expected to be detected as extended in the catalogs produced from deeper eROSITA surveys. Clusters in Class 5 are also secure galaxy clusters identified by the optical identification of eROMaPPer. However, their electron density profiles tend to be more extended than those in Class 4. These clusters include very extended low redshift and rich local clusters. They are not detected because their surface brightness profiles may differ from a simple β-profile, which is used in the detection chain. Including these clusters in the extent-selected samples requires another method of detection, for instance, wavelet-based algorithms (wavdetect; Käfer et al. 2020).
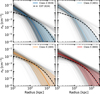 |
Fig. 13 Electron density profiles for clusters with confident (>2σ) X-ray luminosity measurements, split by class. The median of these profiles and the 16th and 84th percentiles are denoted by the solid line and the shaded regions. We also include the median profile of the B24 extent-selected sample to highlight the differences in both populations. The profiles of Class 2 and 3 clusters are cuspier, and Class 4 and 5 appear flatter and more extended; we note that we do detect extended emission, especially for the latter two classes. |
7 Summary
The main eRASS1 cluster catalog was compiled based on the extended morphology of the X-ray emission (Bulbul et al. 2024; Kluge et al. 2024). Galaxy cluster samples constructed using extended X-ray emission from the ICM are known to be incomplete for low flux limits and compact clusters. In this work, we examined the eRASS1 point source catalog (Merloni et al. 2024) to identify clusters that were missed by the extent likelihood selection that was adopted to construct the main eRASS1 cluster catalogs. This work opens up a discovery space for finding clusters with unusually strong cool cores that the currently used detection algorithms have missed.
In order to identify the misclassified clusters as point sources, we used an analogous way to treat the sample of extended X-ray sources in eRASS1. We applied the red sequence-based cluster-finding algorithm eROMaPPer in scanning mode at the positions of all eROSITA detected point sources. Overdensities of passive galaxies on the red sequence were identified within a search radius Rλ, and redshifts were calculated based on their colors or archival spectroscopic data. To clean the sample further, we selected secure X-ray detections with DET_LIKE ≥ 8 in clean sky regions (IN_XGOOD); selected sources with red-sequence galaxies identified with a redshift z > 0.05, but within the local depth limit of the Legacy Surveys (IN_ZVLIM); selected sources with a masked area of less than 30%; and required a richness λnorm ≥ 16 and optical cluster likelihood ℒmax ≥ 20. The catalog was then cleaned of duplicate entries by constructing associations of clusters that share more than 70% of their members with others, keeping only those with the highest ℒmax value. Each of the point sources in the LS DR 10 region also has an optical counterpart assigned to the X-ray emission using the NWAY algorithm. The properties of these counterparts were quantified via the association probability, their spectroscopic (if available) and photometric redshifts, and an assessment of whether it is likely to be Galactic. The final sample comprises 8347 clusters in the point source catalog. In the literature, cross-matches with public optical, X-ray, and SZ surveys reveal that 5819 of the 8347 clusters are novel detections by eROSITA, corresponding to 70 % of the final sample. This discovery rate is similar to that of the eRASS1 extent-selected sample reported in B24; K24.
To understand the selection of eRASS1 extent-selected catalog and to identify unusual clusters, we used the optical properties provided by NWAY and eROMaPPer to divide our sample of cluster candidates into six subclasses. The 213 Class 0 detections correspond to no counterpart information, and therefore were only kept for completeness, but not analyzed further. In the subsample of 291 cluster candidates in Class 1, the X-ray emission is likely linked to and dominated by nearby identified Galactic sources or HECATE galaxies. As a result, we also did not conduct further analysis on these objects and only included them in the catalog for completeness. The Class 2 subsample includes 2698 clusters where the counterpart is securely identified by NWAY and has colors consistent with an AGN. The eROMaPPer identified clusters for this class are located at a different redshift. These clusters’ faint X-ray fluxes, below the flux limit of the eRASS1 survey, are likely to be boosted by an AGN in projection. One of the most interesting classes is Class 3, which contains 970 clusters that are likely to host AGN. For this class, the secure counterpart identified by NWAY has colors consistent with AGN, and eROMaPPer provides the same redshift for the cluster based on the red sequence. Since the faint extended X-ray emission from the cluster itself would be dominated by the bright AGN, these clusters are misclassified by the detection algorithm as point sources. The clusters in this subsample are intriguing for AGN feedback studies and are ideal targets for follow-up observations. A prime example of a typical Class 3 cluster is the Phoenix cluster (McDonald et al. 2012). Although the Phoenix cluster is correctly identified and classified in our sample, regrettably, we did not find any similar extreme case in the western Galactic hemisphere. Regardless, we successfully identified several strong cool-core clusters hosting a BCG with significant star formation or AGN activity. The in-depth studies of the X-ray and optical properties of this subsample will be presented in subsequent work (Kluge et al., in prep.). Class 4 contains 1073 clusters where the counterpart has colors typical of early-type red galaxies and is identified as a member galaxy by eROMaPPer. The X-ray morphology of ICM emission from clusters in this class is likely to be more compact than for the extent-selected ones, either because they are located at higher redshifts or because they have a bright cool core. Class 5 includes 3102 clusters where no secure NWAY counterpart can be identified, which could be caused by either the optical data being too shallow or by the absence of such a single source counterpart, implying that the cluster identified by eROMaPPer is the only correct association. Therefore, this class should contain a large number of true clusters.
To understand the selection further, we investigated the electron number density profiles and X-ray centroid offsets obtained from fitting eROSITA X-ray imaging data. Excluding the clusters in the Class 5 subsample, the electron density profiles of most clusters show a peaked X-ray morphology in the sample, confirming that compact X-ray emission, either due to a central point source or a compact core, is responsible for the misclassification by the source detection algorithm. The clusters of Class 2 and Class 3 are associated with AGN along the line of sight, with a large (possibly random) X-ray to BCG offset and PSFlike cuspy electron density profiles. On the other hand, Class 4 clusters have similar BCG-to-X-ray offsets to the extent-selected clusters, indicating a similar population.
This work sheds light on the X-ray selection of shallow surveys such as the first eROSITA All-Sky Survey. We show that the incompleteness in the X-ray detection process of galaxy clusters is induced mostly due to the dense point source population in the surveys. A large fraction of high-redshift clusters presented in this sample will be detected as extended sources in deeper eFEDS or eRASS:5 data. As these surveys become deeper, the faint ICM emission overpowered by nearby point sources can be more consistently disentangled. Expanding the redshift range to z > 0.8–1.1 in forthcoming cosmological analyses using clusters identified in this work will open the discovery space to the transition from the matter-dominated epoch to the dark-energy-dominated cosmic epoch.
Data availability
The X-ray and optical properties of the misclassified clusters presented in this paper, including the NWAY counterpart information, are available at the CDS via https://cdsarc.cds.unistra.fr/viz-bin/cat/J/A+A/701/A283. Descriptions of the column names are provided in Table A.1. Reasonable requests for the member galaxy catalogs can be made to the corresponding author.
Acknowledgements
The authors thank the referee for helpful and constructive comments on the draft. This work is based on data from eROSITA, the soft X-ray instrument aboard SRG, a joint Russian-German science mission supported by the Russian Space Agency (Roskosmos), in the interests of the Russian Academy of Sciences represented by its Space Research Institute (IKI), and the Deutsches Zentrum für Luft- und Raumfahrt (DLR). The SRG spacecraft was built by Lavochkin Association (NPOL) and its subcontractors, and is operated by NPOL with support from the Max Planck Institute for Extraterrestrial Physics (MPE). The development and construction of the eROSITA X-ray instrument was led by MPE, with contributions from the Dr. Karl Remeis Observatory Bamberg & ECAP (FAU Erlangen-Nuernberg), the University of Hamburg Observatory, the Leibniz Institute for Astrophysics Potsdam (AIP), and the Institute for Astronomy and Astrophysics of the University of Tübingen, with the support of DLR and the Max Planck Society. The Argelander Institute for Astronomy of the University of Bonn and the Ludwig Maximilians Universität Munich also participated in the science preparation for eROSITA. The eROSITA data shown here were processed using the eSASS/NRTA software system developed by the German eROSITA consortium. E. Bulbul, A. Liu, S. Zelmer, and X. Zhang acknowledge financial support from the European Research Council (ERC) Consolidator Grant under the European Union’s Horizon 2020 research and innovation program (grant agreement CoG DarkQuest No. 101002585). N. Clerc was financially supported by CNES. VG acknowledges the financial contribution from the contracts Prin-MUR 2022 supported by Next Generation EU (M4.C2.1.1, no. 20227RNLY3 The concordance cosmological model: stress-tests with galaxy clusters). The Legacy Surveys consist of three individual and complement tary projects: the Dark Energy Camera Legacy Survey (DECaLS; Proposal ID #2014B-0404; PIs: David Schlegel and Arjun Dey), the Beijing-Arizona Sky Survey (BASS; NOAO Prop. ID #2015A-0801; PIs: Zhou Xu and Xiaohui Fan), and the Mayall z-band Legacy Survey (MzLS; Prop. ID #2016A-0453; PI: Arjun Dey). DECaLS, BASS and MzLS together include data obtained, respectively, at the Blanco telescope, Cerro Tololo Inter-American Observatory, NSF’s NOIRLab; the Bok telescope, Steward Observatory, University of Arizona; and the Mayall telescope, Kitt Peak National Observatory, NOIRLab. Pipeline processing and analyses of the data were supported by NOIRLab and the Lawrence Berkeley National Laboratory (LBNL). The Legacy Surveys project is honored to be permitted to conduct astronomical research on Iolkam Du’ag (Kitt Peak), a mountain with particular significance to the Tohono O’odham Nation. NOIRLab is operated by the Association of Universities for Research in Astronomy (AURA) under a cooperative agreement with the National Science Foundation. LBNL is managed by the Regents of the University of California under contract to the U.S. Department of Energy. This project used data obtained with the Dark Energy Camera (DECam), which was constructed by the Dark Energy Survey (DES) collaboration. Funding for the DES Projects has been provided by the U.S. Department of Energy, the U.S. National Science Foundation, the Ministry of Science and Education of Spain, the Science and Technology Facilities Council of the United Kingdom, the Higher Education Funding Council for England, the National Center for Supercomputing Applications at the University of Illinois at Urbana-Champaign, the Kavli Institute of Cosmological Physics at the University of Chicago, Center for Cosmology and Astro-Particle Physics at the Ohio State University, the Mitchell Institute for Fundamental Physics and Astronomy at Texas A&M University, Financiadora de Estudos e Projetos, Fundacao Carlos Chagas Filho de Amparo, Financiadora de Estudos e Projetos, Fundacao Carlos Chagas Filho de Amparo a Pesquisa do Estado do Rio de Janeiro, Conselho Nacional de Desenvolvimento Cientifico e Tecnologico and the Ministerio da Ciencia, Tecnologia e Inovacao, the Deutsche Forschungsgemeinschaft and the Collaborating Institutions in the Dark Energy Survey. The Collaborating Institutions are Argonne National Laboratory, the University of California at Santa Cruz, the University of Cambridge, Centro de Investigaciones Energeticas, Medioambientales y Tecnologicas-Madrid, the University of Chicago, University College London, the DES-Brazil Consortium, the University of Edinburgh, the Eidgenossische Technische Hochschule (ETH) Zurich, Fermi National Accelerator Laboratory, the University of Illinois at Urbana-Champaign, the Institut de Ciencies de l’Espai (IEEC/CSIC), the Institut de Fisica d’Altes Energies, Lawrence Berkeley National Laboratory, the Ludwig Maximilians Universitat Munchen and the associated Excellence Cluster Universe, the University of Michigan, NSF’s NOIRLab, the University of Nottingham, the Ohio State University, the University of Pennsylvania, the University of Portsmouth, SLAC National Accelerator Laboratory, Stanford University, the University of Sussex, and Texas A&M University. BASS is a key project of the Telescope Access Program (TAP), which has been funded by the National Astronomical Observatories of China, the Chinese Academy of Sciences (the Strategic Priority Research Program “The Emergence of Cosmological Structures” Grant # XDB09000000), and the Special Fund for Astronomy from the Ministry of Finance. The BASS is also supported by the External Cooperation Program of Chinese Academy of Sciences (Grant # 114A11KYSB20160057), and Chinese National Natural Science Foundation (Grant # 12120101003, # 11433005). The Legacy Survey team makes use of data products from the Near-Earth Object Wide-field Infrared Survey Explorer (NEOWISE), which is a project of the Jet Propulsion Laboratory/California Institute of Technology. NEOWISE is funded by the National Aeronautics and Space Administration. The Legacy Surveys imaging of the DESI footprint is supported by the Director, Office of Science, Office of High Energy Physics of the U.S. Department of Energy under Contract No. DE-AC02-05CH1123, by the National Energy Research Scientific Computing Center, a DOE Office of Science User Facility under the same contract; and by the U.S. National Science Foundation, Division of Astronomical Sciences under Contract No. AST-0950945 to NOAO. This work made use of the following Python libraries for data processing: SciPy (Virtanen et al. 2020), matplotlib (Hunter 2007), NumPy (Harris et al. 2020), and Astropy (Astropy Collaboration 2022). This research made use of the VizieR catalog access tool, CDS, Strasbourg, France (Ochsenbein 1996). The original description of the VizieR service was published in Ochsenbein et al. (2000).
Appendix A Description of column names
We provide the column names of the published catalog in Table A.1.
Column names, symbols adopted to represent them, units, data types and brief descriptions of the columns provided for the catalog of the 8347 misidentified clusters. We abbreviate the counterpart assigned by NWAY as CTP for brevity. We provide variants of column names in square brackets with the variants separated by semicolons; for example, BEST_Z[;_ERR] indicates the presence of a BEST_Z and a BEST_Z_ERR column. The suffixes _ERR, _L, and _U respectively denote the symmetrical, lower, and upper 1σ errors of the quantity preceding them.
Appendix B More details on the shared member analysis
As described in Sect. 3.1.2, we ensure to reduce duplicates in our catalog by bundling cluster candidates with a high amount (fs,max ≥ 0.7, cf. Eq. (5))4 of shared members. In this part of the Appendix, we describe some aspects of this method left out above for brevity.
For each cluster candidate, we identify all other cluster candidates where fs,max is above the threshold and assemble them in associations. In a second step, we iteratively combine all associations of such cluster candidates that transitively share member fractions above that threshold. This can lead to two candidates being placed into the same association while not having a respective membership fraction fs,max ≥ 0.7 but with fractions exceeding the threshold with a third candidate. An illustration of this scenario is provided in Fig. B.1. Here, candidates 1, 2, and 3 form an association because the fs,max of candidates 1 and 2 links to candidate 3 (additionally indicated by arrow color). Candidate three has only fs,max = 80/120 = 0.67 with candidates 1 and 2. Since both have their shared member fraction with 3 exceeding the threshold, they are linked to it and are thus also transitively linked with each other. The example also contains another candidate (4), which is not associated with any of the other candidates as neither of its shared member fractions exceeds fs,max = 0.7, independent of the side they are being considered from.5 In this case, we would count candidate four as an individual candidate. We note that for this analysis, the membership probabilities assigned by eROMaPPer are not considered (except for determining ℒmax), as the association alone provides a handle on the overlap. We employ this transitive association process to identify 3119 of such unique associations with shared membership fractions exceeding the threshold among respective candidates, in total finding 6025 misclassified cluster candidates to be part of them. A brief visual inspection confirms that the association method works as anticipated, i.e., the identified candidates in associations indeed share member galaxies appearing to be part of the same optical cluster. The distribution of the number of candidates in those associations is displayed in Fig. B.2. We note that the fraction of clusters in the point source catalog (shown with the dashed line in Fig. 2) decreases with the Ncandidate. All 41 associations with 10 or more candidates contain at least one extended cluster. When looking at their redshifts, we find that almost all of those are at z < 0.1, where the larger extent increases the chance of the clusters overlapping with random background X-ray point sources. For each association, we assess whether the maximum physical distance between each pair of clusters is feasible. For this, we consider their position in the sky and photometric redshifts zλ. The limits are set by considering the uncertainties on the photometric redshifts: We flag all associations with any candidates i, j that have dij,max > 2Δd, where we define Δd as the uncertainty on the comoving distance derived from the maximum photometric redshift uncertainty. We find 54 of such associations in total, of which only 15 are purely point source associations. Visual inspection of these cases showed that even for these, the member galaxies could still belong to the same (possibly disturbed) optical cluster. Therefore, we decided to keep them in the sample as part of the same association. We also note that, as also illustrated in Fig. B.1, our association procedure can lead to cases where even fs,max is below the threshold for some of the candidates in an association. This is the case for 107 candidates. Most associations only consist of just two or three candidates, reflecting the cases where only the cluster with the lower number of members has a shared member fraction above the threshold.
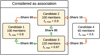 |
Fig. B.1 Illustration of the transitive association process. The numbers of members and shared members are arbitrarily chosen. The labels on the arrows indicate the number of shared members between the respective candidates; their colors denote whether their shared numbers would lead to the two candidates being associated (green) or not (orange). |
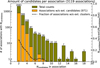 |
Fig. B.2 Distribution of the number of cluster candidates in each transitive association sharing members above the threshold. The height of the green bars and the numbers annotated show the total number of associations that contain Ncandidate. The yellow bars display the number of associations containing Ncandidate where none of the included candidates in the association is an extent-selected cluster. The dashed line shows the fraction of these associations as a function of the total amount for each Ncandidate. For better visibility, we omit the 41 associations where Ncandidate exceeded 20, most notably one association containing 50 overlapping candidates. |
After the removal of duplicates, as mentioned at the end of Sect. 3.1.2, we cross-match the remaining candidates with the extent-selected K24 catalog. Here we provide further details on this step, and provide possible explanations for why the 16 were not identified by the shared member analysis.
For each cluster, we calculate the closest distance to a match, dmatch,min, and define a HAS_CLOSE_EXT_NEIGHBOR flag via the condition ![Mathematical equation: $\[d_{\text {match,min }} \leq R_{\lambda, \text {ext}}^{*}\]$](/articles/aa/full_html/2025/09/aa53942-25/aa53942-25-eq12.png) . Here, the extent-selected cluster’s richness radius Rλ,ext is being calculated as introduced in Eq. (1), and converted to an angular distance
. Here, the extent-selected cluster’s richness radius Rλ,ext is being calculated as introduced in Eq. (1), and converted to an angular distance ![Mathematical equation: $\[R_{\lambda, \text {ext}}^{*}\]$](/articles/aa/full_html/2025/09/aa53942-25/aa53942-25-eq13.png) using its redshift zext. We also calculate the relative redshift offset between misclassified cluster redshift zero and extent-selected cluster redshift zext, Δzrel := |zero − zext|/(1 + zext). We then consider all misclassified cluster candidates for which both HAS_CLOSE_EXT_NEIGHBOR and Δzrel ≤ 0.05 to be duplicates of extent-selected clusters. This concerns only 16 candidates, as the shared member analysis has successfully removed most duplicates at this point; we identify two reasons for those being missed by the shared member analysis:
using its redshift zext. We also calculate the relative redshift offset between misclassified cluster redshift zero and extent-selected cluster redshift zext, Δzrel := |zero − zext|/(1 + zext). We then consider all misclassified cluster candidates for which both HAS_CLOSE_EXT_NEIGHBOR and Δzrel ≤ 0.05 to be duplicates of extent-selected clusters. This concerns only 16 candidates, as the shared member analysis has successfully removed most duplicates at this point; we identify two reasons for those being missed by the shared member analysis:
The optical cluster is very extended on the sky, causing the shared member fraction between the two to be just below the threshold of fs,max = 0.7.
The extent-selected and corresponding misclassified cluster candidate identified by eROMaPPer are located on different heal pixel tiles. Thus, they do not share any members even though they correspond to the same cluster. This effect is rare since our MASKFRAC cut already excludes most candidates that could be affected by it.
There remain 121 misclassified cluster candidates that are located close to an extent-selected cluster (with CLOSEST_EXT_IS_CLOSE) but are at different redshifts. For 9 of these, a secondary redshift estimate Z_LAMBDA_SECOND of the extent-selected cluster is available, which for 7 sources matches zero of the misclassified cluster. Most of the other extent-selected cluster matches are at rather low redshifts (zext ≲ 0.1), and we believe those to be genuinely different clusters that just happen to overlap in projection with the misclassified cluster matches.
Appendix C Description of the cross-matched catalogs
Here we provide more detailed descriptions of the cluster samples we cross-matched our sample to in Sect. 4.
C.1 Optically selected cluster samples
In the literature, extensive work has been conducted to gather optically selected samples from data of ground-based observatories, such as the Sloan Digital Survey (SDSS), the Dark Energy Survey (DES), and the Abell Catalogs Abell et al. (1989), as well as a dedicated infrared/optical surveys for high-redshift clusters (Rykoff et al. 2014; McClintock et al. 2019; Andernach 1991; Gonzalez et al. 2019). Those samples have large overlaps with the sample presented in this work, as the follow-up of the point sources via eROMaPPer can identify similar clusters.
C.2 X-ray selected cluster samples
In the following, we introduce other X-ray selected cluster catalogs from the literature referenced in Table 2.
C.2.1 ROSAT-based catalogs
The first large source catalogs in the X-ray band were compiled using the ROSAT All-Sky Survey (RASS, Voges et al. 1999). However, the optical follow-up of these sources for confirmation had to wait until the large overlapping areas were covered with the optical surveys (e.g., Böhringer et al. 2000; Ebeling et al. 1998; Cruddace et al. 2002; Burenin et al. 2007). The most extensive cluster catalog, MCXC, was constructed from the RASS into a meta catalog of 1743 confirmed clusters in an area with the largest overlap with the eROSITA survey by Piffaretti et al. (2011). Other extensive cluster catalogs, such as CODEX (Finoguenov et al. 2020), are based on the X-ray detection of the RASS, identifying counterparts in the overlapping SDSS area reaching down an X-ray flux limit of 10−13 erg s−1 cm−2. Another RASS-based survey we cross-match against is the extended Massive Cluster Survey (eMACS, Ebeling et al. 2025), a sample of 111 highly X-ray luminous clusters of galaxies at 0.5 ≲ z ≲ 0.9 with an overlap of 38 clusters in the German half of the eROSITA sky.
C.2.2 XMM-Newton-based catalogs
Another deep limited area X-ray survey is the XXL survey performed with XMM-Newton, covering 50 deg2 (Adami et al. 2018). Other surveys based on XMM-Newton archival observations include the XMM-Newton Cluster Survey (XCS Mehrtens et al. 2012) and XMM-Newton Cluster Archive Super Survey (XCLASS Koulouridis et al. 2021). We find a total of 15 and 14 clusters in the XXL and XCS surveys. Additionally, we found 61 cross-matched clusters in a wider area covered in the X-CLASS survey. The median redshifts range between 0.4 to 0.45 with 20″ − 30″ offset, larger than the cross matches in the extent-selected eRASS1 sample, following a similar trend overall with the other cross-matched samples.
C.2.3 The eFEDS cluster samples
Right after the launch of eROSITA, a limited area 140 deg2 survey in the Equatorial strip (the eROSITA Final Equatorial Depth Survey, eFEDS) was conducted, having ~10 times deeper exposure than eRASS1. Based on these data, an extent-selected cluster catalog was presented in Liu et al. (2022), while Bulbul et al. (2022) identified and classified 346 cluster candidates that are included in the point source catalog in Salvato et al. (2022). While we use a classification scheme for the galaxy clusters identified at point-like X-ray positions in this work loosely resembling that of Salvato et al. (2022), there are some crucial differences between the underlying data, the photometric redshift estimation method, and the algorithm employed to identify the clusters. The distinction between extended and point-like sources in the eFEDS field is based on an extent-likelihood cut of ℒext ≥ 6; as suggested by Bulbul et al. (2022), this cut is changed to ℒext ≥ 3 for the eRASS1 primary sample to facilitate the identification of galaxy groups and high-redshift clusters with compact X-ray morphologies.
References
- Abbott, T. M. C., Aguena, M., Alarcon, A., et al. 2020, Phys. Rev. D, 102, 023509 [Google Scholar]
- Abdullah, M. H., Klypin, A., & Wilson, G. 2020, ApJ, 901, 90 [NASA ADS] [CrossRef] [Google Scholar]
- Abell, G. O., Corwin, Harold G., J., & Olowin, R. P. 1989, ApJS, 70, 1 [NASA ADS] [CrossRef] [Google Scholar]
- Adami, C., Giles, P., Koulouridis, E., et al. 2018, A&A, 620, A5 [NASA ADS] [CrossRef] [EDP Sciences] [Google Scholar]
- Aihara, H., Arimoto, N., Armstrong, R., et al. 2018, PASJ, 70, S4 [NASA ADS] [Google Scholar]
- Andernach, H. 1991, in Astronomical Society of the Pacific Conference Series, 15, Large-scale Structures and Peculiar Motions in the Universe, eds. D. W. Latham, & L. A. N. da Costa, 279 [Google Scholar]
- Artis, E., Ghirardini, V., Bulbul, E., et al. 2024, A&A, 691, A301 [NASA ADS] [CrossRef] [EDP Sciences] [Google Scholar]
- Artis, E., Bulbul, E., Grandis, S., et al. 2025, A&A, 696, A5 [NASA ADS] [CrossRef] [EDP Sciences] [Google Scholar]
- Asplund, M., Grevesse, N., Sauval, A. J., & Scott, P. 2009, ARA&A, 47, 481 [NASA ADS] [CrossRef] [Google Scholar]
- Astropy Collaboration (Price-Whelan, A. M., et al.) 2022, ApJ, 935, 167 [NASA ADS] [CrossRef] [Google Scholar]
- Bahar, Y. E., Bulbul, E., Clerc, N., et al. 2022, A&A, 661, A7 [NASA ADS] [CrossRef] [EDP Sciences] [Google Scholar]
- Bahar, Y. E., Bulbul, E., Ghirardini, V., et al. 2024, A&A, 691, A188 [NASA ADS] [CrossRef] [EDP Sciences] [Google Scholar]
- Balogh, M. L., van der Burg, R. F. J., Muzzin, A., et al. 2021, MNRAS, 500, 358 [Google Scholar]
- Bleem, L. E., Stalder, B., de Haan, T., et al. 2015, ApJS, 216, 27 [Google Scholar]
- Bleem, L. E., Bocquet, S., Stalder, B., et al. 2020, ApJS, 247, 25 [Google Scholar]
- Bocquet, S., Dietrich, J. P., Schrabback, T., et al. 2019, ApJ, 878, 55 [Google Scholar]
- Böhringer, H., Schuecker, P., Guzzo, L., et al. 2004, A&A, 425, 367 [NASA ADS] [CrossRef] [EDP Sciences] [Google Scholar]
- Böhringer, H., Voges, W., Huchra, J. P., et al. 2000, ApJS, 129, 435 [Google Scholar]
- Boller, T., Freyberg, M. J., Trümper, J., et al. 2016, A&A, 588, A103 [NASA ADS] [CrossRef] [EDP Sciences] [Google Scholar]
- Bower, R. G., Lucey, J. R., & Ellis, R. S. 1992, MNRAS, 254, 589 [NASA ADS] [CrossRef] [Google Scholar]
- Brunner, H., Liu, T., Lamer, G., et al. 2022, A&A, 661, A1 [NASA ADS] [CrossRef] [EDP Sciences] [Google Scholar]
- Bulbul, E., Liu, A., Pasini, T., et al. 2022, A&A, 661, A10 [NASA ADS] [CrossRef] [EDP Sciences] [Google Scholar]
- Bulbul, G. E., Hasler, N., Bonamente, M., & Joy, M. 2010, ApJ, 720, 1038 [NASA ADS] [CrossRef] [Google Scholar]
- Bulbul, E., Liu, A., Kluge, M., et al. 2024, A&A, 685, A106 [NASA ADS] [CrossRef] [EDP Sciences] [Google Scholar]
- Burenin, R. A., Vikhlinin, A., Hornstrup, A., et al. 2007, ApJS, 172, 561 [Google Scholar]
- Busch, P., & White, S. D. M. 2017, MNRAS, 470, 4767 [CrossRef] [Google Scholar]
- Carlström, J., Garaud, J., & Babaev, E. 2011, Phys. Rev. B, 84, 134518 [Google Scholar]
- Chiu, I. N., Ghirardini, V., Liu, A., et al. 2022, A&A, 661, A11 [NASA ADS] [CrossRef] [EDP Sciences] [Google Scholar]
- Clerc, N., & Finoguenov, A. 2023, in Handbook of X-ray and Gamma-ray Astrophysics, 123 [Google Scholar]
- Clerc, N., Ramos-Ceja, M. E., Ridl, J., et al. 2018, A&A, 617, A92 [NASA ADS] [CrossRef] [EDP Sciences] [Google Scholar]
- Clerc, N., Comparat, J., Seppi, R., et al. 2024, A&A, 687, A238 [NASA ADS] [CrossRef] [EDP Sciences] [Google Scholar]
- Cruddace, R., Voges, W., Böhringer, H., et al. 2002, ApJS, 140, 239 [NASA ADS] [CrossRef] [Google Scholar]
- Dey, A., Schlegel, D. J., Lang, D., et al. 2019, AJ, 157, 168 [Google Scholar]
- Donahue, M., Funkhouser, K., Koeppe, D., Frisbie, R. L. S., & Voit, G. M. 2020, ApJ, 889, 121 [NASA ADS] [CrossRef] [Google Scholar]
- Dressler, A. 1980, ApJ, 236, 351 [Google Scholar]
- Ebeling, H., Edge, A. C., Bohringer, H., et al. 1998, MNRAS, 301, 881 [Google Scholar]
- Ebeling, H., Richard, J., Beauchesne, B., et al. 2025, MNRAS, 537, 2662 [Google Scholar]
- Finoguenov, A., Rykoff, E., Clerc, N., et al. 2020, A&A, 638, A114 [NASA ADS] [CrossRef] [EDP Sciences] [Google Scholar]
- Gaia Collaboration (Prusti, T., et al.) 2016, A&A, 595, A1 [NASA ADS] [CrossRef] [EDP Sciences] [Google Scholar]
- Gaia Collaboration (Vallenari, A., et al.) 2023, A&A, 674, A1 [NASA ADS] [CrossRef] [EDP Sciences] [Google Scholar]
- Ghirardini, V., Bulbul, E., Artis, E., et al. 2024, A&A, 689, A298 [NASA ADS] [CrossRef] [EDP Sciences] [Google Scholar]
- Gladders, M. D., & Yee, H. K. C. 2000, AJ, 120, 2148 [NASA ADS] [CrossRef] [Google Scholar]
- Gonzalez, A. H., Gettings, D. P., Brodwin, M., et al. 2019, ApJS, 240, 33 [NASA ADS] [CrossRef] [Google Scholar]
- Grandis, S., Ghirardini, V., Bocquet, S., et al. 2024, A&A, 687, A178 [NASA ADS] [CrossRef] [EDP Sciences] [Google Scholar]
- Green, T. S., Edge, A. C., Ebeling, H., et al. 2017, MNRAS, 465, 4872 [NASA ADS] [CrossRef] [Google Scholar]
- Harris, C. R., Millman, K. J., van der Walt, S. J., et al. 2020, Nature, 585, 357 [NASA ADS] [CrossRef] [Google Scholar]
- HI4PI Collaboration (Ben Bekhti, N., et al.) 2016, A&A, 594, A116 [NASA ADS] [CrossRef] [EDP Sciences] [Google Scholar]
- Hilton, M., Sifón, C., Naess, S., et al. 2021, ApJS, 253, 3 [Google Scholar]
- Huang, N., Bleem, L. E., Stalder, B., et al. 2020, AJ, 159, 110 [Google Scholar]
- Huang, X., Storfer, C., Gu, A., et al. 2021, ApJ, 909, 27 [NASA ADS] [CrossRef] [Google Scholar]
- Hunter, J. D. 2007, Comput. Sci. Eng., 9, 90 [NASA ADS] [CrossRef] [Google Scholar]
- Ider Chitham, J., Comparat, J., Finoguenov, A., et al. 2020, MNRAS, 499, 4768 [NASA ADS] [CrossRef] [Google Scholar]
- Käfer, F., Finoguenov, A., Eckert, D., et al. 2020, A&A, 634, A8 [Google Scholar]
- Kleinebreil, F., Grandis, S., Schrabback, T., et al. 2025, A&A, 695, A216 [NASA ADS] [CrossRef] [EDP Sciences] [Google Scholar]
- Kluge, M., Neureiter, B., Riffeser, A., et al. 2020, ApJS, 247, 43 [Google Scholar]
- Kluge, M., Comparat, J., Liu, A., et al. 2024, A&A, 688, A210 [NASA ADS] [CrossRef] [EDP Sciences] [Google Scholar]
- Koulouridis, E., Clerc, N., Sadibekova, T., et al. 2021, A&A, 652, A12 [NASA ADS] [CrossRef] [EDP Sciences] [Google Scholar]
- Kovlakas, K., Zezas, A., Andrews, J. J., et al. 2021, MNRAS, 506, 1896 [NASA ADS] [CrossRef] [Google Scholar]
- Lang, D. 2014, AJ, 147, 108 [Google Scholar]
- Lang, D., Hogg, D. W., & Mykytyn, D. 2016, The Tractor: Probabilistic astronomical source detection and measurement, Astrophysics Source Code Library [record ascl:1604.008] [Google Scholar]
- Liu, A., Bulbul, E., Ghirardini, V., et al. 2022, A&A, 661, A2 [NASA ADS] [CrossRef] [EDP Sciences] [Google Scholar]
- Liu, A., Bulbul, E., Ramos-Ceja, M. E., et al. 2023, A&A, 670, A96 [NASA ADS] [CrossRef] [EDP Sciences] [Google Scholar]
- Liu, A., Bulbul, E., Kluge, M., et al. 2024a, A&A, 683, A130 [NASA ADS] [CrossRef] [EDP Sciences] [Google Scholar]
- Liu, A., Bulbul, E., Shin, T., et al. 2024b, A&A, 688, A186 [NASA ADS] [CrossRef] [EDP Sciences] [Google Scholar]
- Mainzer, A., Bauer, J., Cutri, R. M., et al. 2014, ApJ, 792, 30 [Google Scholar]
- McClintock, T., Varga, T. N., Gruen, D., et al. 2019, MNRAS, 482, 1352 [Google Scholar]
- McDonald, M., Bayliss, M., Benson, B. A., et al. 2012, Nature, 488, 349 [Google Scholar]
- Mehrtens, N., Romer, A. K., Hilton, M., et al. 2012, MNRAS, 423, 1024 [NASA ADS] [CrossRef] [Google Scholar]
- Meisner, A. M., Lang, D., & Schlegel, D. J. 2017a, AJ, 154, 161 [NASA ADS] [CrossRef] [Google Scholar]
- Meisner, A. M., Lang, D., & Schlegel, D. J. 2017b, AJ, 153, 38 [Google Scholar]
- Merloni, A., Lamer, G., Liu, T., et al. 2024, A&A, 682, A34 [NASA ADS] [CrossRef] [EDP Sciences] [Google Scholar]
- Ochsenbein, F. 1996, The VizieR database of astronomical catalogues, https://vizier.cds.unistra.fr [Google Scholar]
- Ochsenbein, F., Bauer, P., & Marcout, J. 2000, A&AS, 143, 23 [NASA ADS] [CrossRef] [EDP Sciences] [Google Scholar]
- Oguri, M. 2014, MNRAS, 444, 147 [NASA ADS] [CrossRef] [Google Scholar]
- Piffaretti, R., Arnaud, M., Pratt, G. W., Pointecouteau, E., & Melin, J. B. 2011, A&A, 534, A109 [NASA ADS] [CrossRef] [EDP Sciences] [Google Scholar]
- Planck Collaboration XXIX. 2014, A&A, 571, A29 [NASA ADS] [CrossRef] [EDP Sciences] [Google Scholar]
- Planck Collaboration XXVII. 2016, A&A, 594, A27 [NASA ADS] [CrossRef] [EDP Sciences] [Google Scholar]
- Predehl, P., Andritschke, R., Arefiev, V., et al. 2021, A&A, 647, A1 [EDP Sciences] [Google Scholar]
- Rozo, E., Rykoff, E., Koester, B., et al. 2011, ApJ, 740, 53 [NASA ADS] [CrossRef] [Google Scholar]
- Ruiz, A., Corral, A., Mountrichas, G., & Georgantopoulos, I. 2018, A&A, 618, A52 [NASA ADS] [CrossRef] [EDP Sciences] [Google Scholar]
- Rykoff, E. S., Koester, B. P., Rozo, E., et al. 2012, ApJ, 746, 178 [NASA ADS] [CrossRef] [Google Scholar]
- Rykoff, E. S., Rozo, E., Busha, M. T., et al. 2014, ApJ, 785, 104 [Google Scholar]
- Rykoff, E. S., Rozo, E., & Keisler, R. 2015, arXiv e-prints [arXiv:1509.00870] [Google Scholar]
- Rykoff, E. S., Rozo, E., Hollowood, D., et al. 2016, ApJS, 224, 1 [NASA ADS] [CrossRef] [Google Scholar]
- Salvato, M., Wolf, J., Dwelly, T., et al. 2025, A&A, submitted [arXiv:2509.02842] [Google Scholar]
- Salvato, M., Buchner, J., Budavári, T., et al. 2018, MNRAS, 473, 4937 [Google Scholar]
- Salvato, M., Wolf, J., Dwelly, T., et al. 2022, A&A, 661, A3 [NASA ADS] [CrossRef] [EDP Sciences] [Google Scholar]
- Sanders, J. S., Fabian, A. C., Russell, H. R., & Walker, S. A. 2018, MNRAS, 474, 1065 [NASA ADS] [CrossRef] [Google Scholar]
- Saxena, A., Salvato, M., Roster, W., et al. 2024, A&A, 690, A365 [NASA ADS] [CrossRef] [EDP Sciences] [Google Scholar]
- Schechter, P. 1976, ApJ, 203, 297 [Google Scholar]
- Seppi, R., Comparat, J., Bulbul, E., et al. 2022, A&A, 665, A78 [NASA ADS] [CrossRef] [EDP Sciences] [Google Scholar]
- Seppi, R., Comparat, J., Ghirardini, V., et al. 2024, A&A, 686, A196 [NASA ADS] [CrossRef] [EDP Sciences] [Google Scholar]
- Silva, D. R., Blum, R. D., Allen, L., et al. 2016, in American Astronomical Society Meeting Abstracts, 228, American Astronomical Society Meeting Abstracts #228, 317.02 [Google Scholar]
- Somboonpanyakul, T., McDonald, M., Gaspari, M., Stalder, B., & Stark, A. A. 2021, ApJ, 910, 60 [NASA ADS] [CrossRef] [Google Scholar]
- Sunyaev, R. A., & Zeldovich, Y. B. 1972, Comments Astrophys. Space Phys., 4, 173 [NASA ADS] [EDP Sciences] [Google Scholar]
- Sunyaev, R., Arefiev, V., Babyshkin, V., et al. 2021, A&A, 656, A132 [NASA ADS] [CrossRef] [EDP Sciences] [Google Scholar]
- Vikhlinin, A., Kravtsov, A., Forman, W., et al. 2006, ApJ, 640, 691 [Google Scholar]
- Virtanen, P., Gommers, R., Oliphant, T. E., et al. 2020, Nat. Methods, 17, 261 [Google Scholar]
- Voges, W., Aschenbach, B., Boller, T., et al. 1999, A&A, 349, 389 [NASA ADS] [Google Scholar]
- Von Der Linden, A., Best, P. N., Kauffmann, G., & White, S. D. M. 2007, MNRAS, 379, 867 [Google Scholar]
- Wen, Z. L., & Han, J. L. 2018, MNRAS, 481, 4158 [CrossRef] [Google Scholar]
- Zenteno, A., Hernández-Lang, D., Klein, M., et al. 2020, MNRAS, 495, 705 [Google Scholar]
- Zou, H., Zhou, X., Fan, X., et al. 2017, PASP, 129, 064101 [CrossRef] [Google Scholar]
- Zu, Y., Mandelbaum, R., Simet, M., Rozo, E., & Rykoff, E. S. 2017, MNRAS, 470, 551 [CrossRef] [Google Scholar]
Further details are available at https://erosita.mpe.mpg.de/dr1/eSASS4DR1/
This is a sufficient estimation for an area of 8R500 × 8R500 region, then used for the X-ray analysis to include both cluster and background.
For the extent-selected clusters, K24 found that only 3% of their extent-selected clusters exceeded that threshold; we note that, unlike our point source sample, the extended X-ray sources had already been split-cleaned based on their extent before the application of eROMaPPer. While a similar procedure (i.e., position-based split cleaning) is possible here by assuming a minimum radial extent for each source, after some experiments, we found that approaching this problem via the shared member fractions is more successful at removing duplicates.
For example, with 50 shared members with either one of the other clusters, candidate four would become part of the association since it would then have fs,max = 0.83.
All Tables
Contribution of clusters from eROMaPPer runs using the filter band combinations in the Bands column, as described in Sect. 3.1.3.
Public cluster catalogs cross-matched with clusters in the eRASS1 misclassified cluster catalog of this work.
Redshift types available for clusters in the misclassified cluster catalog. The first column shows the priority assigned, while the Available column denotes how many redshifts are available with the given redshift type, and the Best column reflects how many of these were used for the best redshift estimate.
Column names, symbols adopted to represent them, units, data types and brief descriptions of the columns provided for the catalog of the 8347 misidentified clusters. We abbreviate the counterpart assigned by NWAY as CTP for brevity. We provide variants of column names in square brackets with the variants separated by semicolons; for example, BEST_Z[;_ERR] indicates the presence of a BEST_Z and a BEST_Z_ERR column. The suffixes _ERR, _L, and _U respectively denote the symmetrical, lower, and upper 1σ errors of the quantity preceding them.
All Figures
|
Fig. 1 Illustration of the data flow discussed in Sect. 3.1 for assembling the cleaned and merged sample. The number of remaining sources after the selected steps is annotated in black. The respective filtering steps described in Sect. 3.1.1 are annotated in the blue boxes. |
| In the text | |
|
Fig. 2 Distribution of the maximally shared member fraction fs,max (Eq. 5) as a function of redshift for 9518 misclassified clusters that share at least one member. fs,max is calculated with respect to the joint member sample of other misclassified clusters and the extent-selected clusters presented by K24. The histograms in the top and right panels show projections of the distributions. The dashed red line indicates the threshold at fs,max = 0.7 that is adopted to mark candidates as part of associations with others. |
| In the text | |
|
Fig. 3 Illustration of the classification process for the cluster classes introduced in Sect. 3.2.2. We abbreviated the counterpart associated via NWAY to CTP for better readability. The decision points are described in detail in Sect. 3.2.1. The numbers in parentheses denote the number of candidates. About one third of the clusters belong to Class 2, where an AGN is located in projection to the cluster. The clusters hosting bright AGN are categorized in Class 3. Misclassified clusters without apparent AGN contribution (Class 4 and Class 5) comprise about one half of the sample, and Galactic contaminants (Class 1) and those sources without counterpart information (Class 0) contribute only a small part. |
| In the text | |
|
Fig. 4 Example LS DR 10 grz images with overlaid X-ray contours for one misclassified cluster candidate of each Class. The green dashed circle marks the location of the X-ray detection’s most likely single-source counterpart determined via NWAY. The important parameters of cluster and counterpart association are annotated. Upper left: Class 1 cluster. Here the X-ray point source is clearly associated with the star, while eROMaPPer identified a nearby cluster in the lower left quadrant, where we marked the BCG to highlight the location of the cluster. Upper center: Class 2 cluster with an AGN clearly associated with the X-ray emission. The foreground cluster emission might contribute partially, as seen by the elongated shape. Upper right: Class 3 cluster with an AGN located at the same redshift z ~ 0.48. The contours resemble those of a point source, with the AGN likely outshining any ICM emission. Lower left: Class 4 cluster, for which the most likely single counterpart is an early-type galaxy that is identified as a member. There is no AGN discernible, and the contours are a little more extended. Lower right: Class 5 cluster, for which the NWAY counterpart is not secure (pany ≈ 0). The X-ray contours have a more extended appearance than the point source of the Class 3 cluster, for example. North is up; east is left, and the images are centered around the initial X-ray point source detections. |
| In the text | |
|
Fig. 5 Relation between the most likely counterpart best redshifts zctp and the corresponding eROMaPPer cluster redshifts zero, split by cluster class. The 1σ error bars corresponding to these best redshifts are indicated in gray. The black lines show zctp = zero ± m(1 + zero) with m = 0 for the straight, m = 0.05 for the dashed lines, and m = 0.15 for the dotted lines. Since photometric redshift estimates for Galactic counterparts are unreliable, we do not show Class 1. |
| In the text | |
|
Fig. 6 Redshift histogram of the eRASS1 misclassified clusters that have matches in the ACT DR5, DES Y1, CODEX, SDSS DR8, and SPT 2500D Surveys, and the redshift histogram (zbest) of all misclassified clusters. The largest overlap of clusters is between the optically selected samples and eROSITA. |
| In the text | |
|
Fig. 7 Distribution of the best redshifts zero assigned by eROMaPPer to the misclassified clusters, split by cluster class for the different panels, displayed in their respective colors. The upper left panel shows the distribution of the full sample combining all classes. The distribution of 5721 extent-selected clusters (B24), filtered the same way as the point source candidates, are displayed in the background in gray to guide the eye. The median of each distribution is indicated by a dashed line. |
| In the text | |
|
Fig. 8 Distribution of the normalized richness estimate λnorm Eq. (3) assigned by eROMaPPer. The bins are equidistant, while the x-axis is displayed logarithmically. The distribution of 5721 extent-selected clusters (K24), filtered in the same way as the misclassified clusters, is displayed in the background to guide the eye. A dashed line indicates the median of each distribution. We do not split the sample by Class here as the distributions are similar. |
| In the text | |
|
Fig. 9 Distribution of the LS DR 10 colors derived from the grzW1 dereddened AB magnitudes of the counterparts, first for the full sample in the upper left panel, followed by counterparts to the different cluster class objects. We show the empirical distinction line (Eq. (7)) to distinguish between Galactic and extragalactic sources. |
| In the text | |
|
Fig. 10 Distribution of the offsets of the fitted MBProj2D X-ray centroid and the optical eROMaPPer BCG coordinates, split by cluster class. The distribution for the 5721 filtered extent-selected clusters is shown in black, normalized for better visibility. The median offsets are indicated by the dashed lines. Compared to the median offset of ~86 kpc found for the filtered extent-selected sample, the offsets are generally higher for Class 2, Class 3, and Class 5 and are much lower than for Class 4. While large offsets can hint at mergers for extent-selected clusters, for the point source sample, they are more likely to indicate a chance projection of the cluster and the real point source along the line of sight. |
| In the text | |
|
Fig. 11 LS DR 10 grz image of 1eRASS J234443.8-424315 overlaid with eRASS1 X-ray contours. This object, also known as the Phoenix cluster (McDonald et al. 2012), is one of the most X-ray luminous clusters and is infamous for being misclassified as a point source due to the bright AGN hosted by the BCG. It is identified as the most likely NWAY counterpart (light green circle), while the BCG reported by the eROMaPPer algorithm (red circle) is offset by ~870 kpc because the true BCG’s colors are too far from the red sequence. North is up; east is left, and the image is centered around the initial point source detection. |
| In the text | |
|
Fig. 12 X-ray luminosity-redshift distribution for the 888 clusters reported in the eFEDS field. The 346 extent-selected eFEDS clusters Liu et al. (2022); Bahar et al. (2022) are denoted by gray circles, and the 542 clusters at positions of eFEDS point sources by gray crosses. Sources with matches to the eRASS1 extent-selected catalog (B24) are marked by small red circles, and small yellow crosses mark sources with matches to the catalog presented in this paper. The average eRASS1 flux limit of ~sim 10−13 erg s−1 cm−2 in the eFEDS field is indicated by the black dashed line. Most extent-selected eFEDS clusters above the flux limit are recovered, even though 54 of the 117 total matches to extent-selected eFEDS clusters are found as a point source in the eRASS1 catalogs. |
| In the text | |
|
Fig. 13 Electron density profiles for clusters with confident (>2σ) X-ray luminosity measurements, split by class. The median of these profiles and the 16th and 84th percentiles are denoted by the solid line and the shaded regions. We also include the median profile of the B24 extent-selected sample to highlight the differences in both populations. The profiles of Class 2 and 3 clusters are cuspier, and Class 4 and 5 appear flatter and more extended; we note that we do detect extended emission, especially for the latter two classes. |
| In the text | |
|
Fig. B.1 Illustration of the transitive association process. The numbers of members and shared members are arbitrarily chosen. The labels on the arrows indicate the number of shared members between the respective candidates; their colors denote whether their shared numbers would lead to the two candidates being associated (green) or not (orange). |
| In the text | |
|
Fig. B.2 Distribution of the number of cluster candidates in each transitive association sharing members above the threshold. The height of the green bars and the numbers annotated show the total number of associations that contain Ncandidate. The yellow bars display the number of associations containing Ncandidate where none of the included candidates in the association is an extent-selected cluster. The dashed line shows the fraction of these associations as a function of the total amount for each Ncandidate. For better visibility, we omit the 41 associations where Ncandidate exceeded 20, most notably one association containing 50 overlapping candidates. |
| In the text | |
Current usage metrics show cumulative count of Article Views (full-text article views including HTML views, PDF and ePub downloads, according to the available data) and Abstracts Views on Vision4Press platform.
Data correspond to usage on the plateform after 2015. The current usage metrics is available 48-96 hours after online publication and is updated daily on week days.
Initial download of the metrics may take a while.