Fig. 10
Download original image
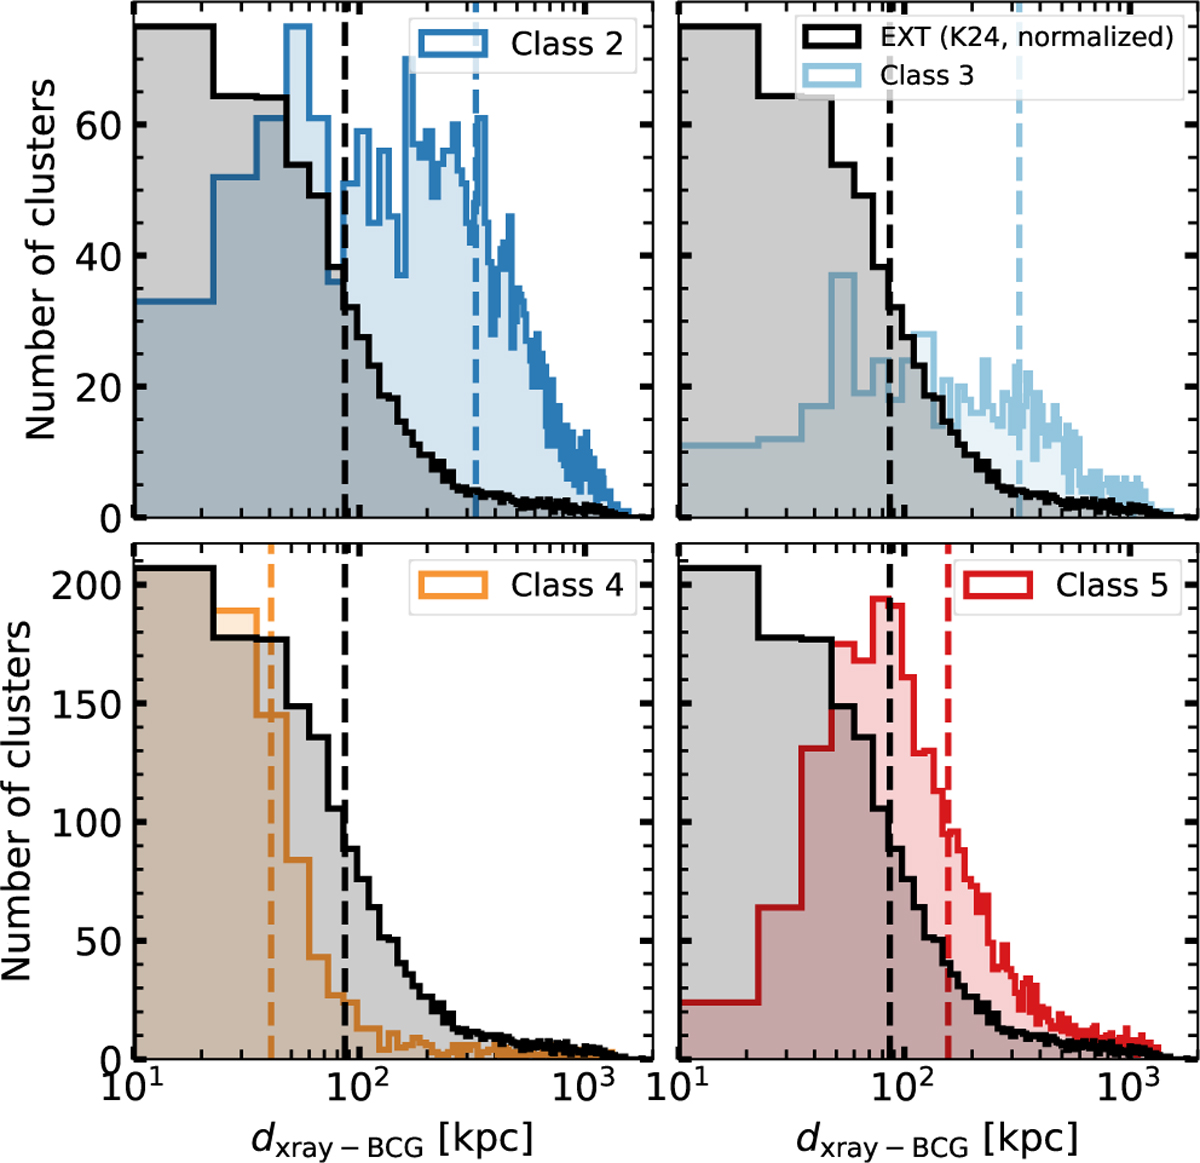
Distribution of the offsets of the fitted MBProj2D X-ray centroid and the optical eROMaPPer BCG coordinates, split by cluster class. The distribution for the 5721 filtered extent-selected clusters is shown in black, normalized for better visibility. The median offsets are indicated by the dashed lines. Compared to the median offset of ~86 kpc found for the filtered extent-selected sample, the offsets are generally higher for Class 2, Class 3, and Class 5 and are much lower than for Class 4. While large offsets can hint at mergers for extent-selected clusters, for the point source sample, they are more likely to indicate a chance projection of the cluster and the real point source along the line of sight.
Current usage metrics show cumulative count of Article Views (full-text article views including HTML views, PDF and ePub downloads, according to the available data) and Abstracts Views on Vision4Press platform.
Data correspond to usage on the plateform after 2015. The current usage metrics is available 48-96 hours after online publication and is updated daily on week days.
Initial download of the metrics may take a while.