Fig. B.2
Download original image
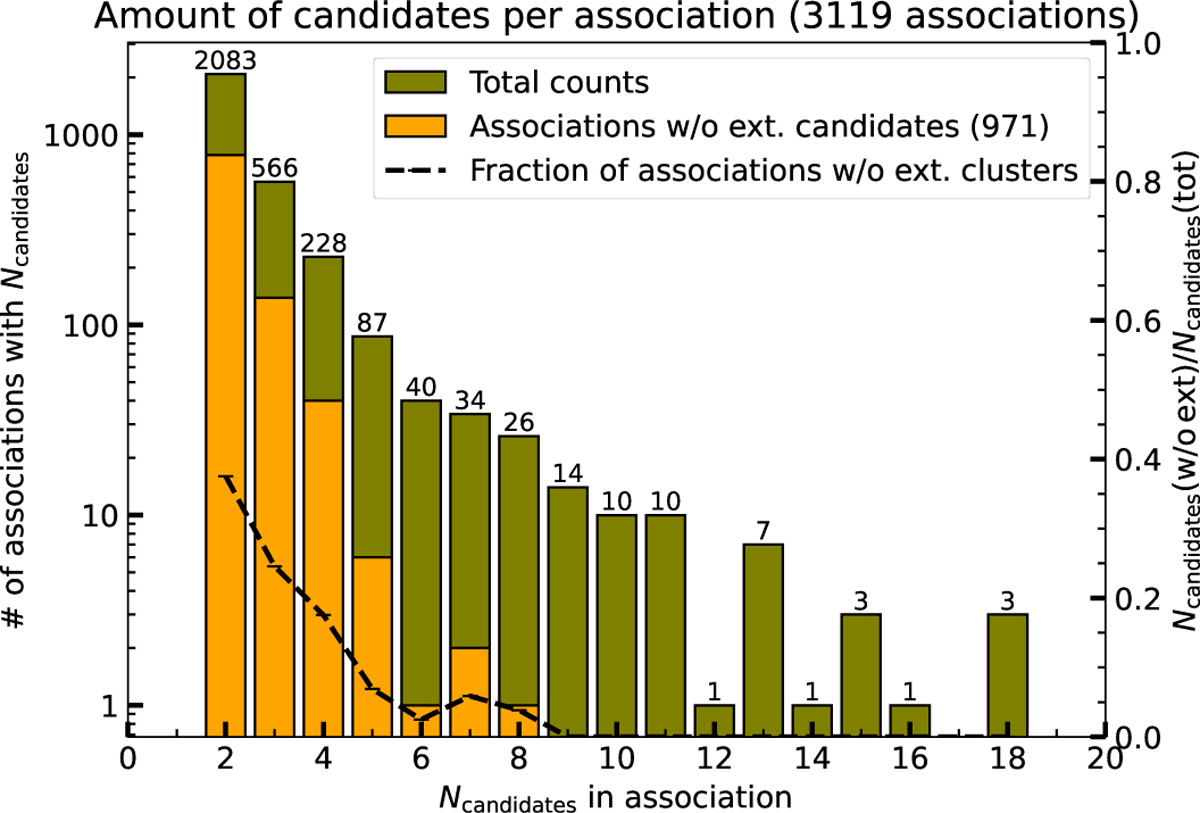
Distribution of the number of cluster candidates in each transitive association sharing members above the threshold. The height of the green bars and the numbers annotated show the total number of associations that contain Ncandidate. The yellow bars display the number of associations containing Ncandidate where none of the included candidates in the association is an extent-selected cluster. The dashed line shows the fraction of these associations as a function of the total amount for each Ncandidate. For better visibility, we omit the 41 associations where Ncandidate exceeded 20, most notably one association containing 50 overlapping candidates.
Current usage metrics show cumulative count of Article Views (full-text article views including HTML views, PDF and ePub downloads, according to the available data) and Abstracts Views on Vision4Press platform.
Data correspond to usage on the plateform after 2015. The current usage metrics is available 48-96 hours after online publication and is updated daily on week days.
Initial download of the metrics may take a while.