Fig. 2
Download original image
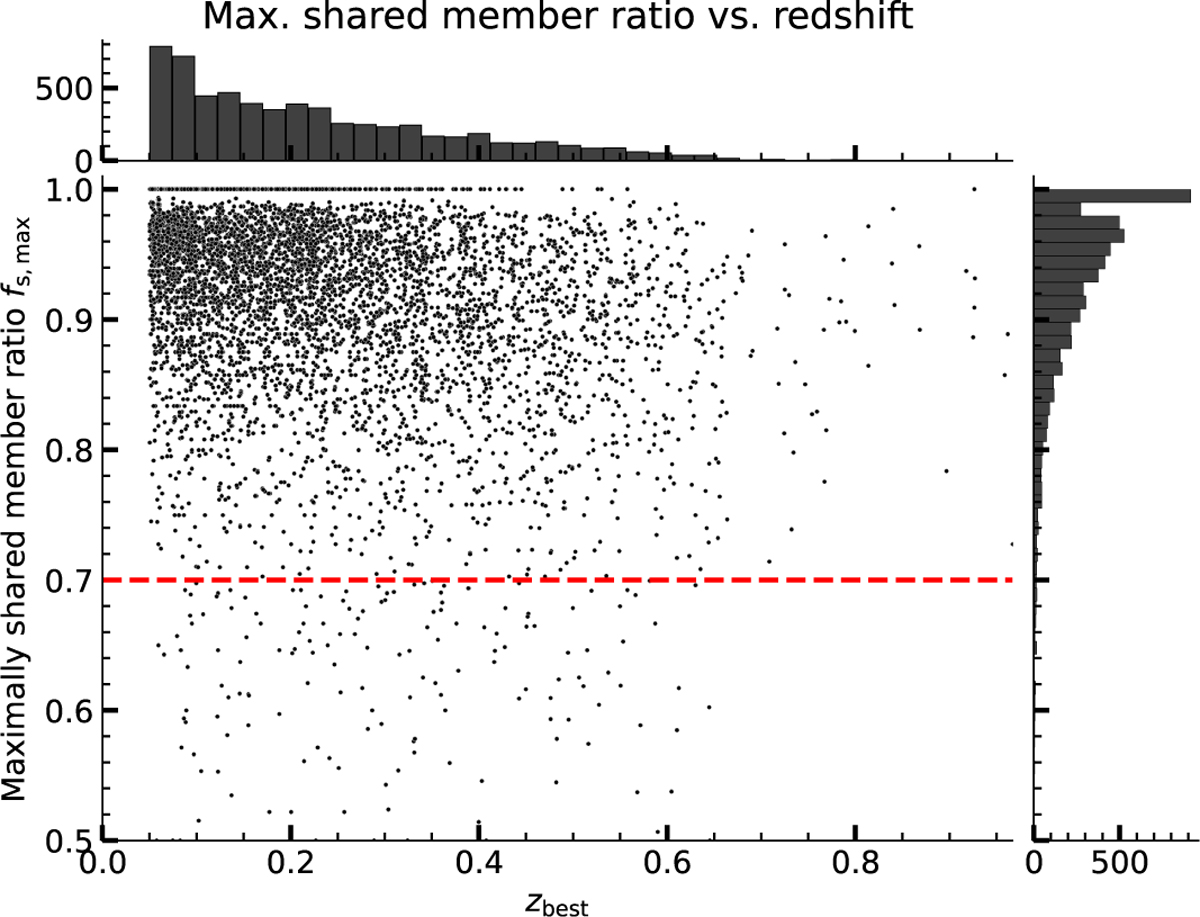
Distribution of the maximally shared member fraction fs,max (Eq. 5) as a function of redshift for 9518 misclassified clusters that share at least one member. fs,max is calculated with respect to the joint member sample of other misclassified clusters and the extent-selected clusters presented by K24. The histograms in the top and right panels show projections of the distributions. The dashed red line indicates the threshold at fs,max = 0.7 that is adopted to mark candidates as part of associations with others.
Current usage metrics show cumulative count of Article Views (full-text article views including HTML views, PDF and ePub downloads, according to the available data) and Abstracts Views on Vision4Press platform.
Data correspond to usage on the plateform after 2015. The current usage metrics is available 48-96 hours after online publication and is updated daily on week days.
Initial download of the metrics may take a while.