Fig. 4
Download original image
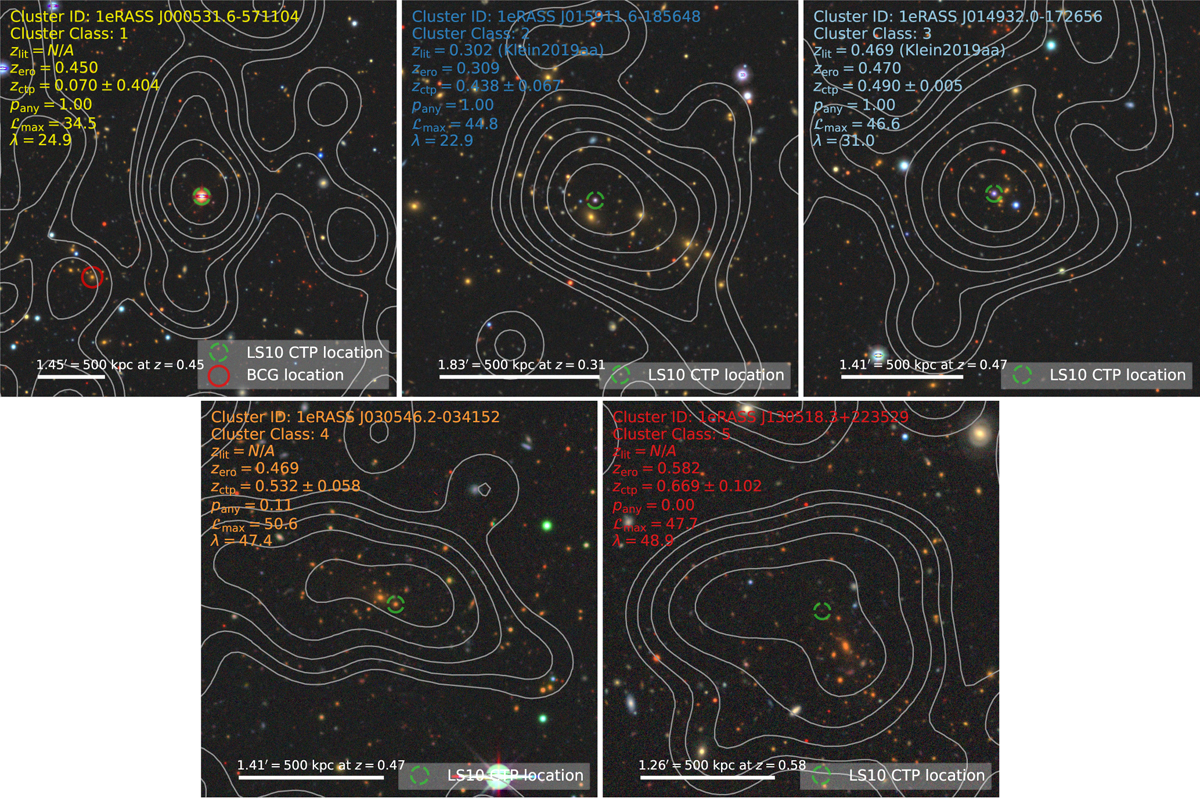
Example LS DR 10 grz images with overlaid X-ray contours for one misclassified cluster candidate of each Class. The green dashed circle marks the location of the X-ray detection’s most likely single-source counterpart determined via NWAY. The important parameters of cluster and counterpart association are annotated. Upper left: Class 1 cluster. Here the X-ray point source is clearly associated with the star, while eROMaPPer identified a nearby cluster in the lower left quadrant, where we marked the BCG to highlight the location of the cluster. Upper center: Class 2 cluster with an AGN clearly associated with the X-ray emission. The foreground cluster emission might contribute partially, as seen by the elongated shape. Upper right: Class 3 cluster with an AGN located at the same redshift z ~ 0.48. The contours resemble those of a point source, with the AGN likely outshining any ICM emission. Lower left: Class 4 cluster, for which the most likely single counterpart is an early-type galaxy that is identified as a member. There is no AGN discernible, and the contours are a little more extended. Lower right: Class 5 cluster, for which the NWAY counterpart is not secure (pany ≈ 0). The X-ray contours have a more extended appearance than the point source of the Class 3 cluster, for example. North is up; east is left, and the images are centered around the initial X-ray point source detections.
Current usage metrics show cumulative count of Article Views (full-text article views including HTML views, PDF and ePub downloads, according to the available data) and Abstracts Views on Vision4Press platform.
Data correspond to usage on the plateform after 2015. The current usage metrics is available 48-96 hours after online publication and is updated daily on week days.
Initial download of the metrics may take a while.