Fig. 7
Download original image
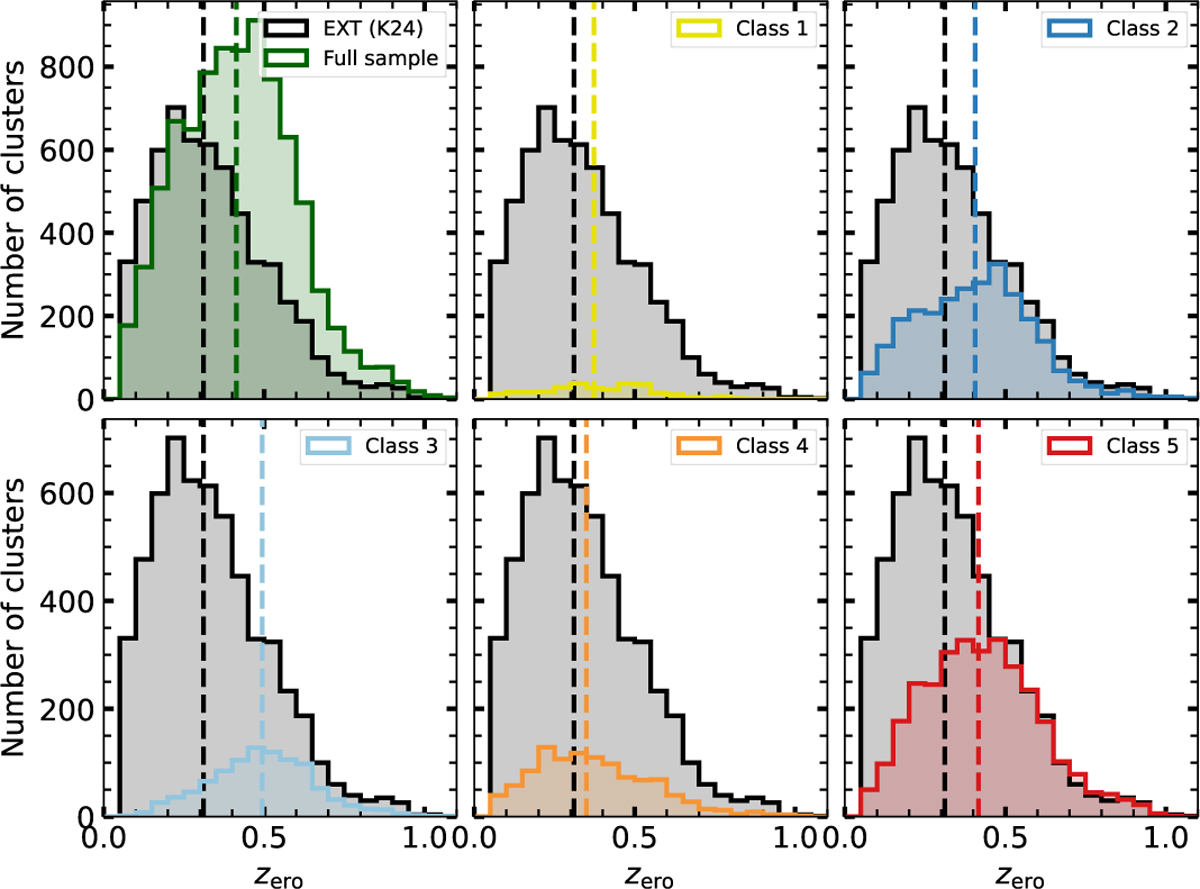
Distribution of the best redshifts zero assigned by eROMaPPer to the misclassified clusters, split by cluster class for the different panels, displayed in their respective colors. The upper left panel shows the distribution of the full sample combining all classes. The distribution of 5721 extent-selected clusters (B24), filtered the same way as the point source candidates, are displayed in the background in gray to guide the eye. The median of each distribution is indicated by a dashed line.
Current usage metrics show cumulative count of Article Views (full-text article views including HTML views, PDF and ePub downloads, according to the available data) and Abstracts Views on Vision4Press platform.
Data correspond to usage on the plateform after 2015. The current usage metrics is available 48-96 hours after online publication and is updated daily on week days.
Initial download of the metrics may take a while.