Fig. 8
Download original image
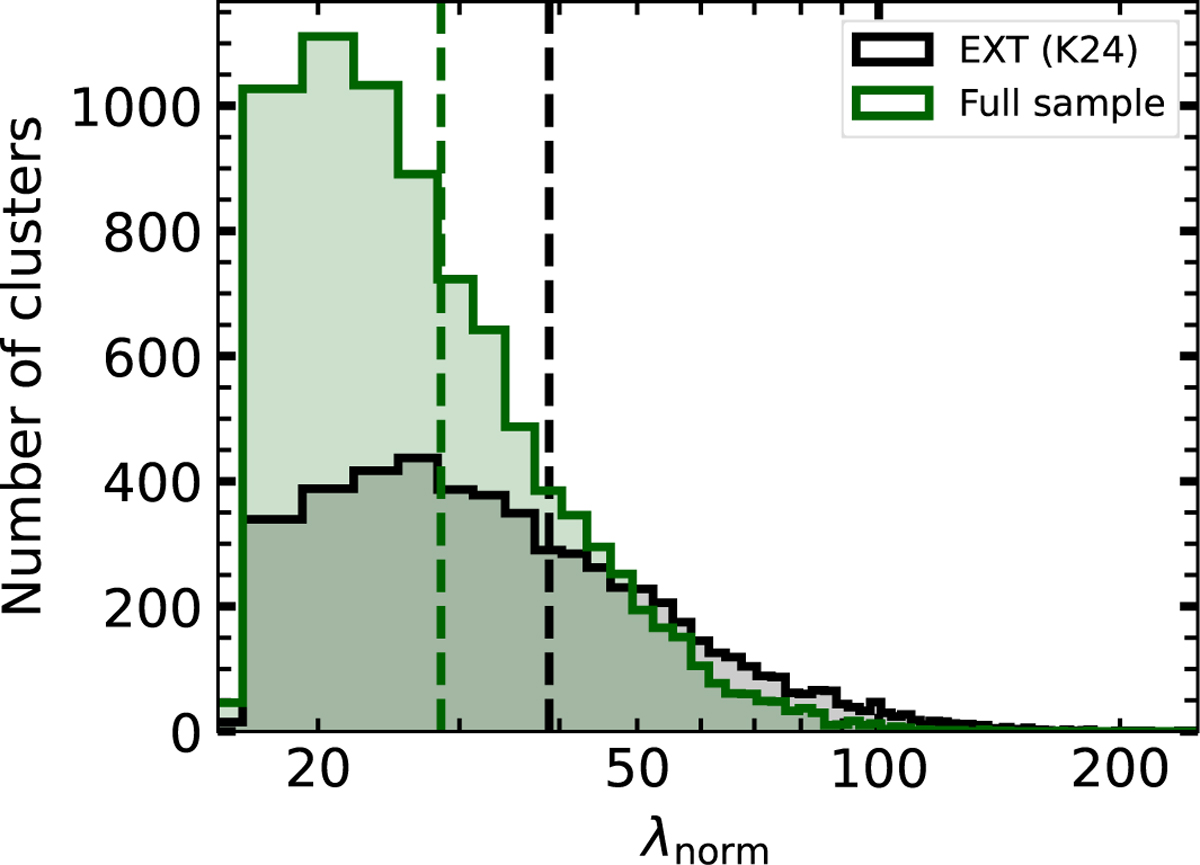
Distribution of the normalized richness estimate λnorm Eq. (3) assigned by eROMaPPer. The bins are equidistant, while the x-axis is displayed logarithmically. The distribution of 5721 extent-selected clusters (K24), filtered in the same way as the misclassified clusters, is displayed in the background to guide the eye. A dashed line indicates the median of each distribution. We do not split the sample by Class here as the distributions are similar.
Current usage metrics show cumulative count of Article Views (full-text article views including HTML views, PDF and ePub downloads, according to the available data) and Abstracts Views on Vision4Press platform.
Data correspond to usage on the plateform after 2015. The current usage metrics is available 48-96 hours after online publication and is updated daily on week days.
Initial download of the metrics may take a while.