Fig. 1
Download original image
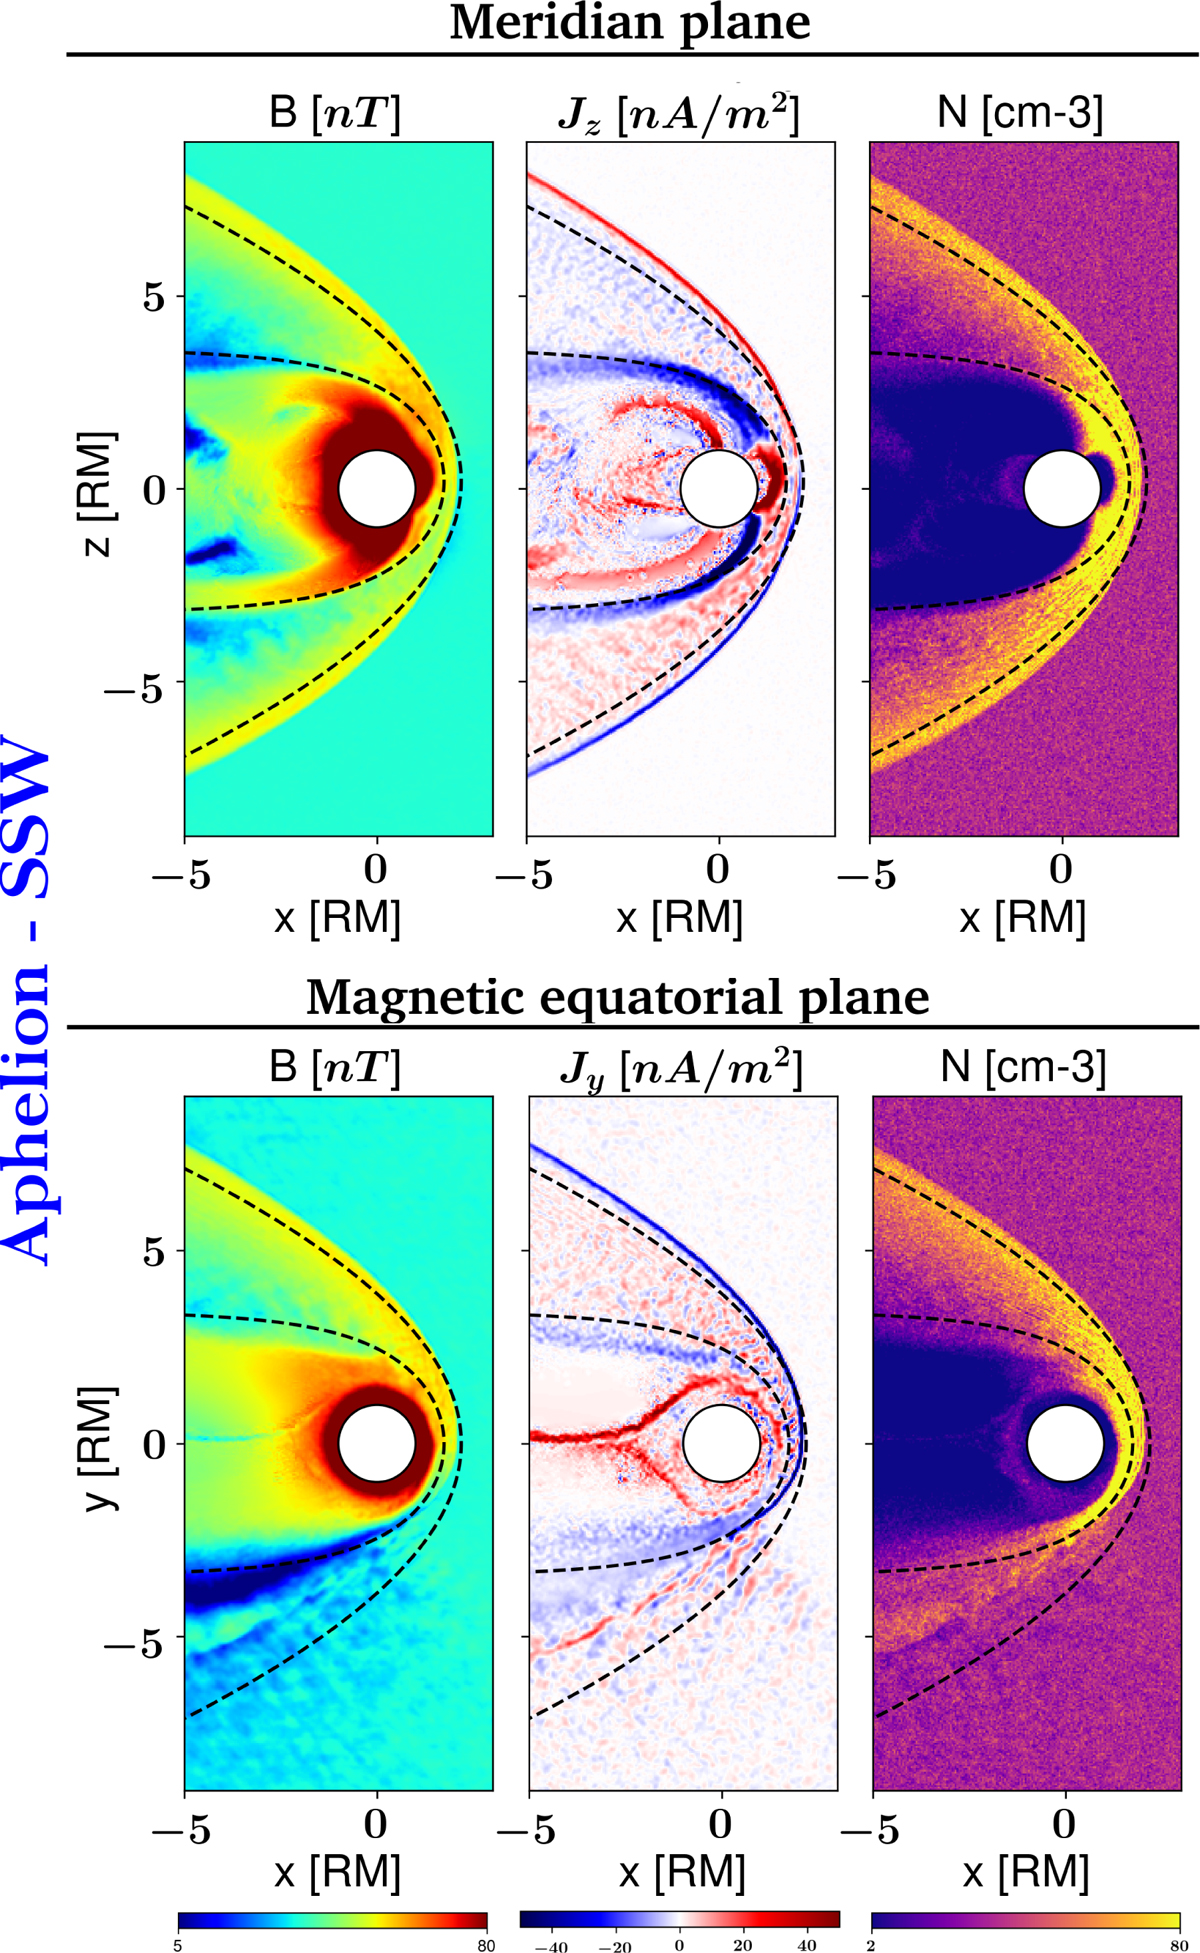
Aphelion SSW scenario. Upper panels show a cross-section in the meridian plane (at Y = 0 km), while lower panels show a cross-section along the magnetic equatorial plane (at Z = 484 km). Each row shows the maps of the magnetic-field intensity, B, the current components (JZ in upper panel and JY in lower panel), and the particle density. The dotted black lines represent the predicted magnetopause and bow shock’s shapes based on the model proposed in Winslow et al. (2013). The Sun is ideally located on the right edge, and the solar wind flows from the right edge to left.
Current usage metrics show cumulative count of Article Views (full-text article views including HTML views, PDF and ePub downloads, according to the available data) and Abstracts Views on Vision4Press platform.
Data correspond to usage on the plateform after 2015. The current usage metrics is available 48-96 hours after online publication and is updated daily on week days.
Initial download of the metrics may take a while.