Fig. 2
Download original image
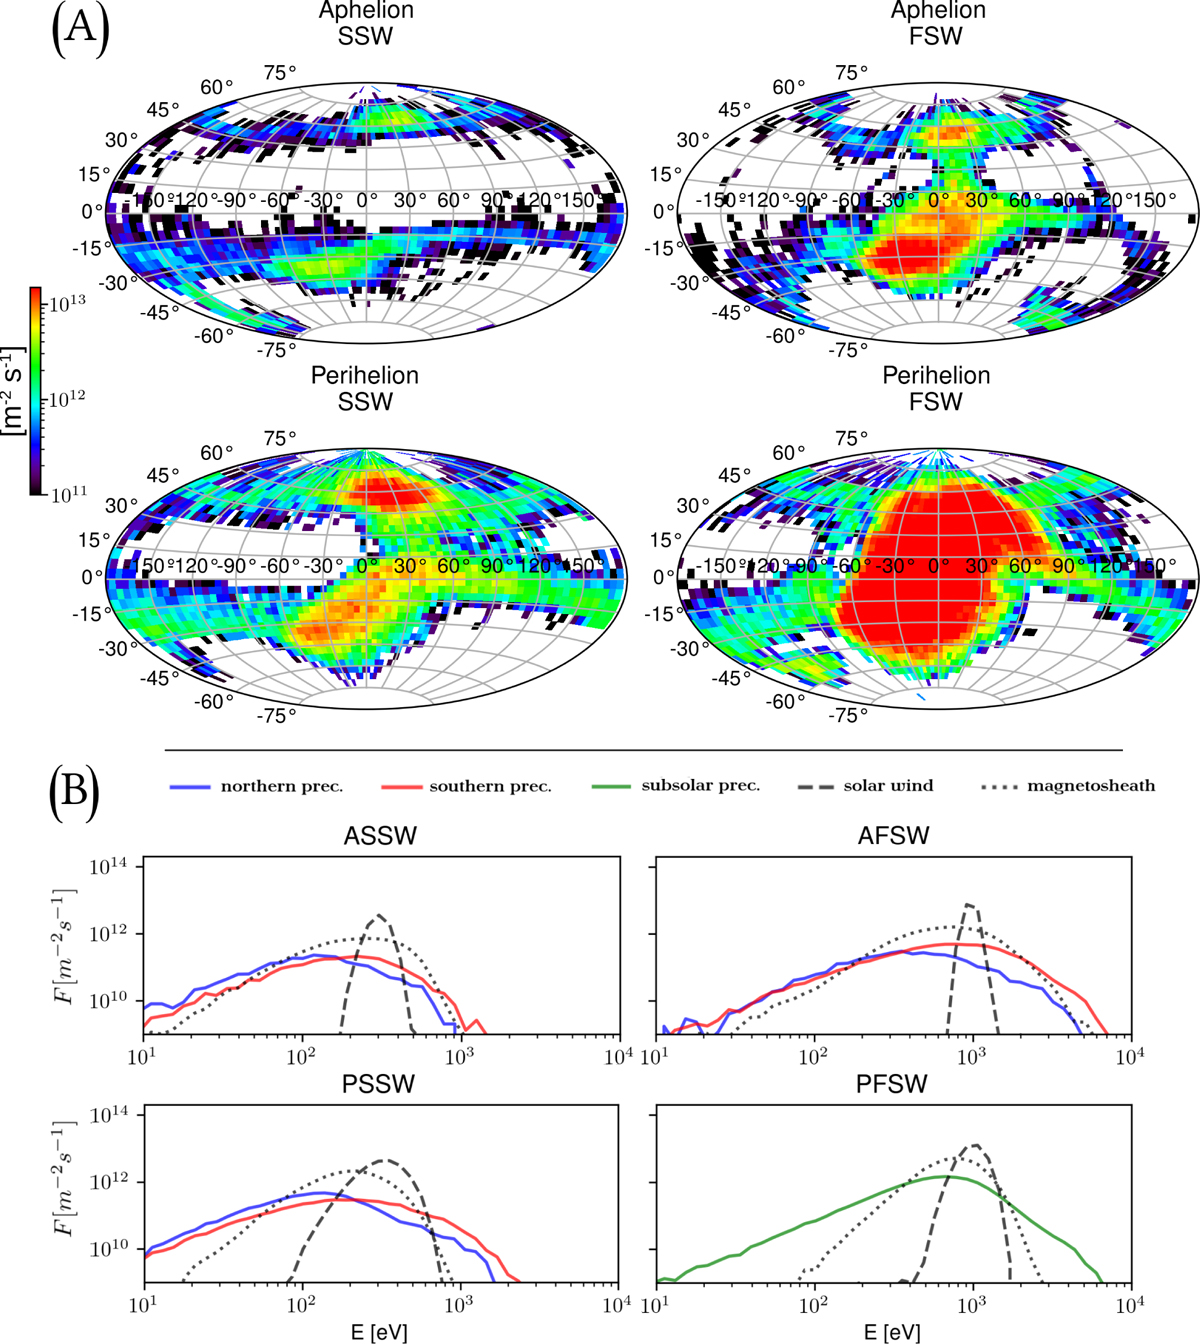
Panels A: set of planetary geographical maps of the solar-wind protons’ precipitation fluxes on the surface for each scenario. Panel B: average energy profiles of the solar-wind protons’ precipitation fluxes for each scenario. The blue lines represent the energy distribution within the northern cusps, the red lines in the southern cusps, and the green line the averaged day-side energy distribution in the case at perihelion with fast solar wind (PFSW). The dashed and dotted lines represent the energy profiles of particle crossing a small window in, respectively, the solar wind and magnetosheath.
Current usage metrics show cumulative count of Article Views (full-text article views including HTML views, PDF and ePub downloads, according to the available data) and Abstracts Views on Vision4Press platform.
Data correspond to usage on the plateform after 2015. The current usage metrics is available 48-96 hours after online publication and is updated daily on week days.
Initial download of the metrics may take a while.