Fig. 3
Download original image
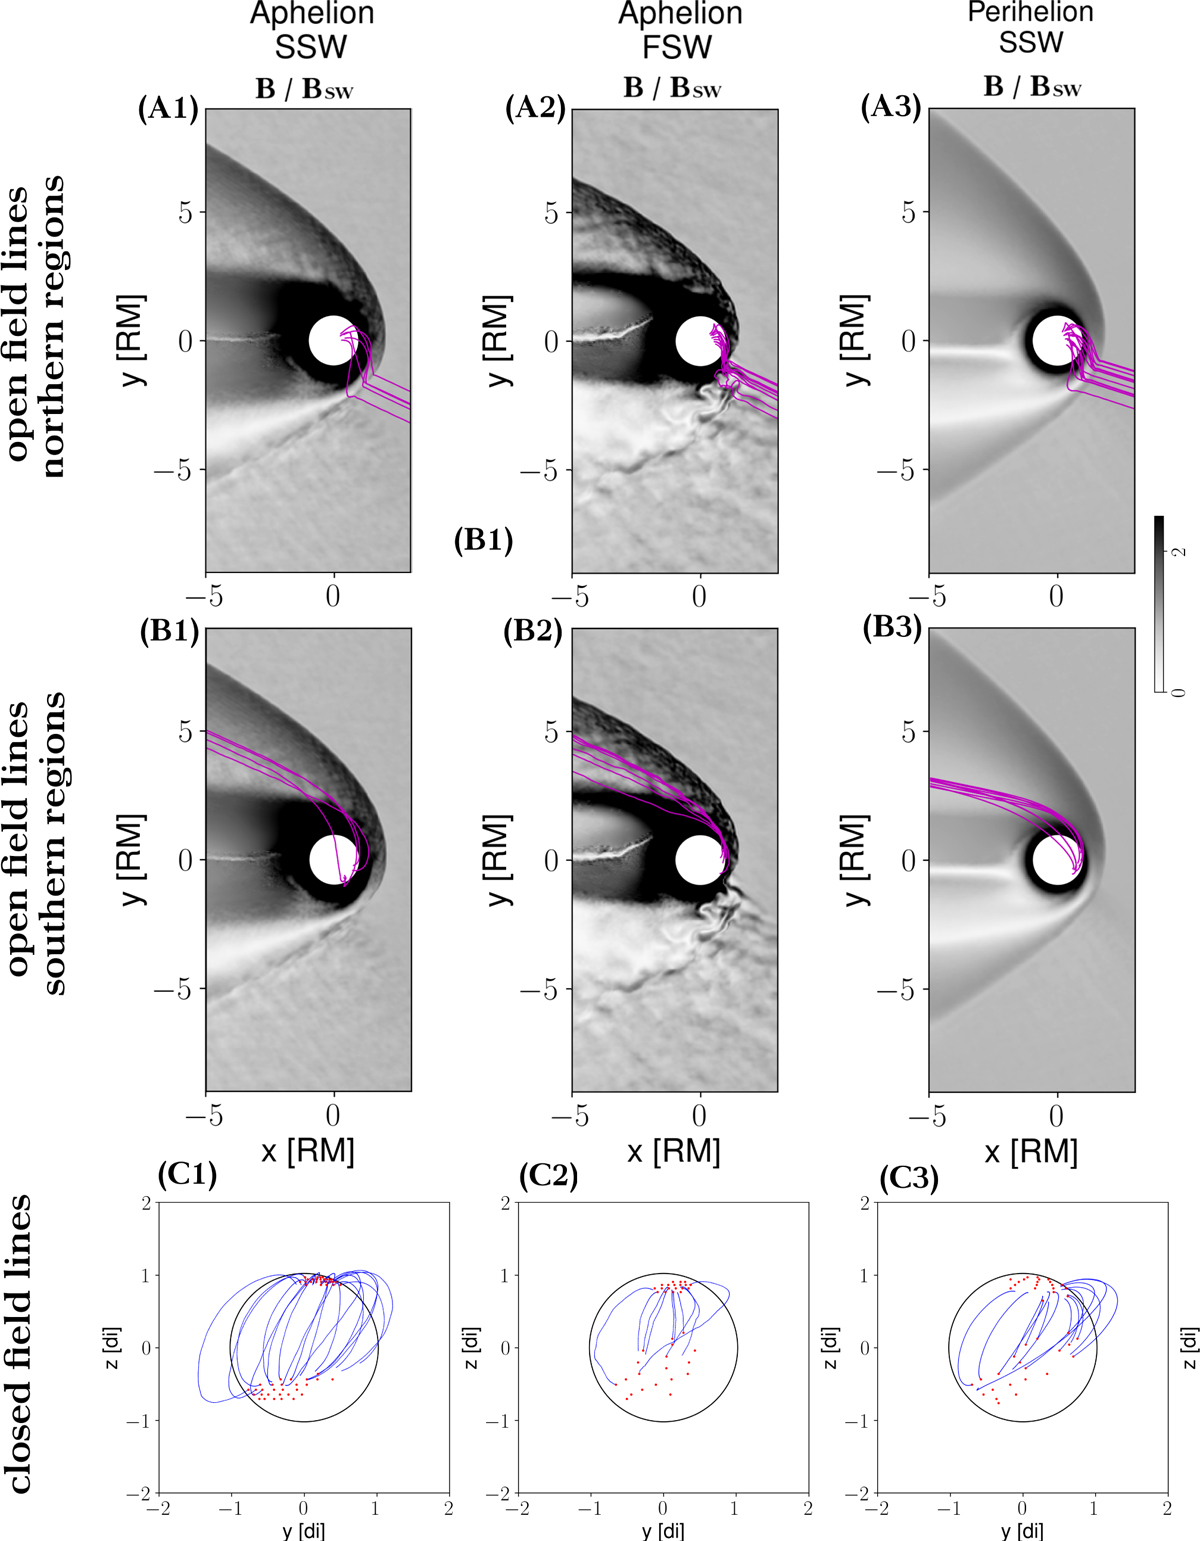
Configuration of magnetic-field lines starting from the cusp regions. The three columns refer to the cases of aphelion SSW, aphelion FSW, and perihelion SSW. The first and second rows represent the pattern of the open magnetic-field lines (purple lines) starting from the northern (panels (A1–3)) and southern (panels (B1–3)) cusps, respectively, as projected on the magnetic equatorial map of the magnetic-field intensity (normalised to the pristine solar wind value). Panels (C1–3) show the closed magnetic-field lines (blue lines) from both the northern and southern solar wind precipitation regions as projected on the YZ terminator plane. The red dots represent the field lines’ footprints; if not associated with any closed field line, they are the footprints of the open field lines shown in Panels A and B.
Current usage metrics show cumulative count of Article Views (full-text article views including HTML views, PDF and ePub downloads, according to the available data) and Abstracts Views on Vision4Press platform.
Data correspond to usage on the plateform after 2015. The current usage metrics is available 48-96 hours after online publication and is updated daily on week days.
Initial download of the metrics may take a while.