Fig. 14
Download original image
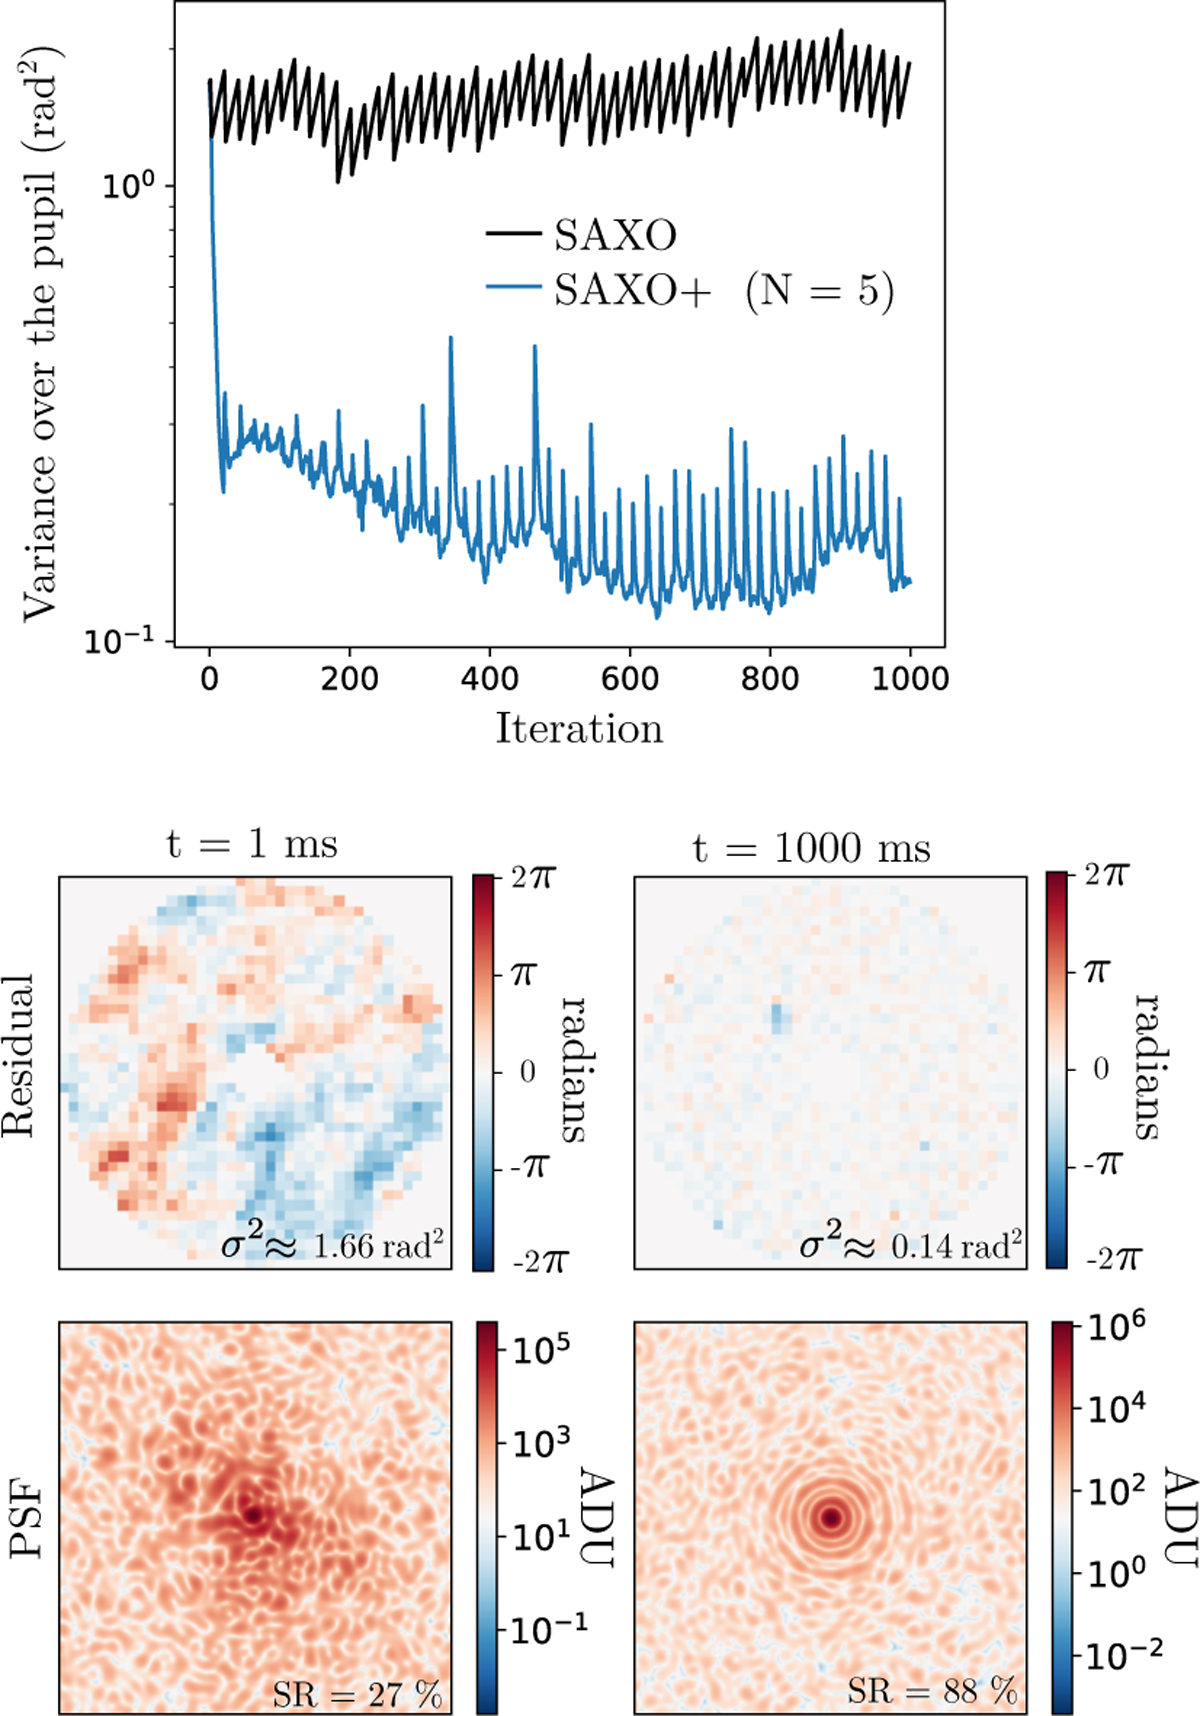
Median seeing SAXO+ simulation with the iMZ as a second stage WFS. The upper graph shows the evolution of phase residual variance (in logarithmic scale) over 1000 correction iterations (loop frequency = 1 kHz) for N = 3 photons/pixel/frame (blue curve). The evolution of phase residual variance after SAXO is overplotted in black (loop frequency = 150 Hz for N = 5 photons/pixel/frame). The lower pictures show residual phase maps and short-exposure focal plane images (log scale) at the beginning and at the end of the one second sequence.
Current usage metrics show cumulative count of Article Views (full-text article views including HTML views, PDF and ePub downloads, according to the available data) and Abstracts Views on Vision4Press platform.
Data correspond to usage on the plateform after 2015. The current usage metrics is available 48-96 hours after online publication and is updated daily on week days.
Initial download of the metrics may take a while.