Fig. 16
Download original image
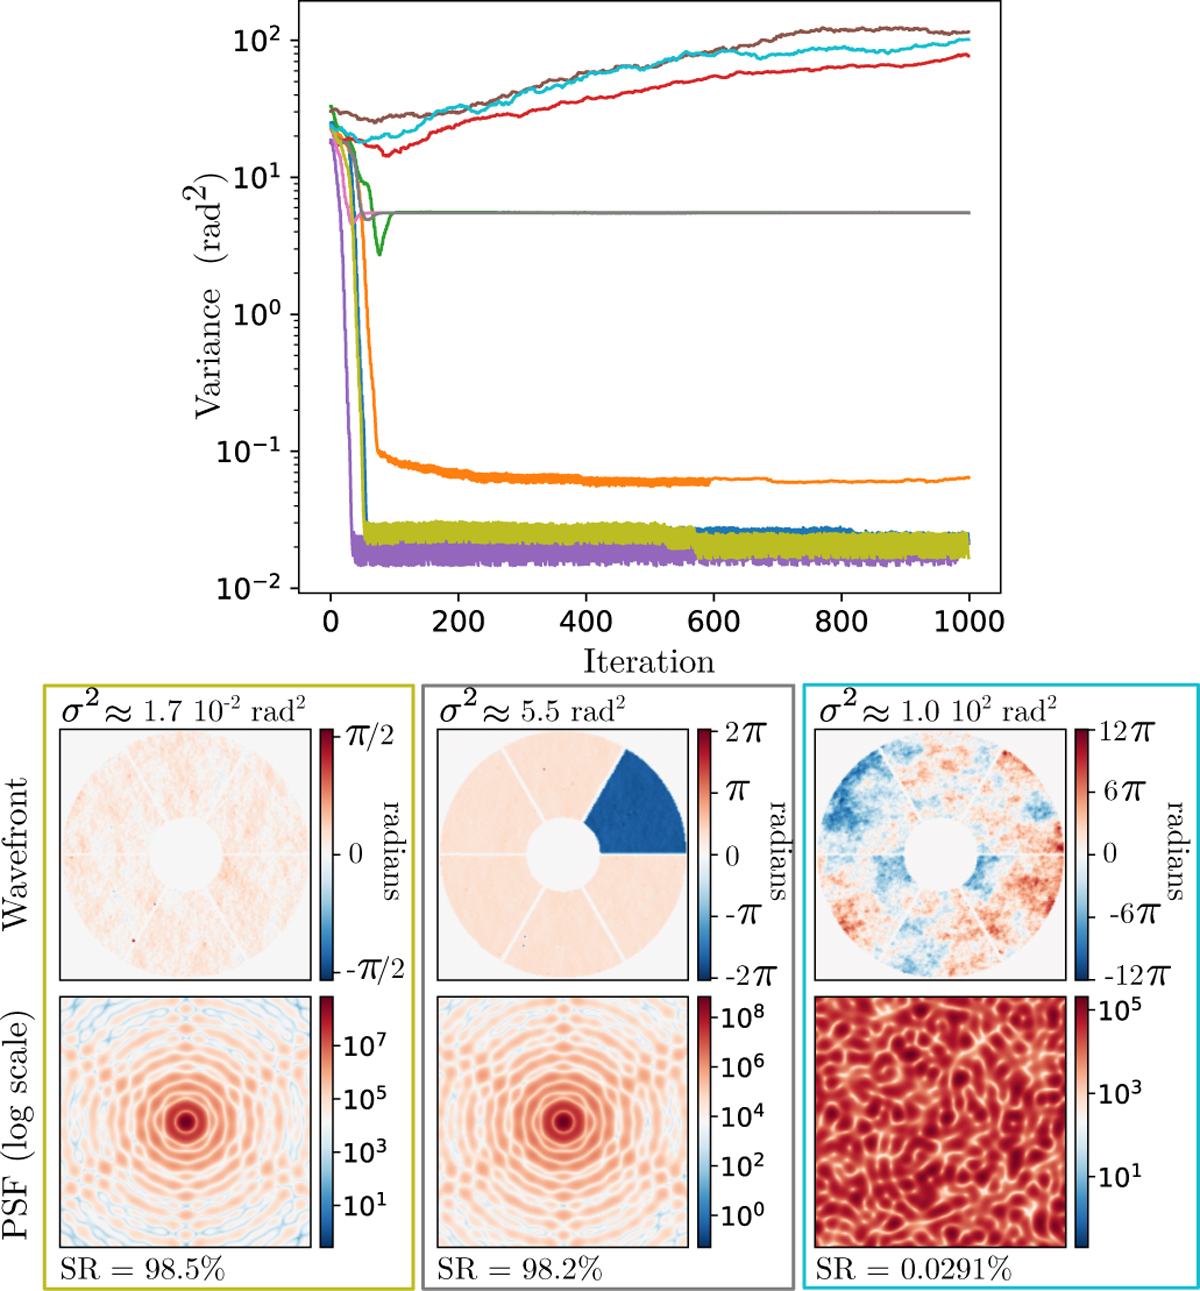
Simulation of the iMZ response with the ELT pupil in closed-loop to ten different atmospheric turbulence sequences corresponding to very good seeing (0.4 arcseconds) and flux conditions (m = 5). Upper part: evolution of the residual phase variance for one second of turbulence, generated with HCIPy (Por et al. 2018). Each of the ten curves correspond to a different turbulence sequence with r0 = 15 cm (42 cm at 1.2 µm) and L0 = 25 m. Bottom part: residual phase maps and corresponding PSFs at the last iteration for three of the ten sequences, representing three typical cases.
Current usage metrics show cumulative count of Article Views (full-text article views including HTML views, PDF and ePub downloads, according to the available data) and Abstracts Views on Vision4Press platform.
Data correspond to usage on the plateform after 2015. The current usage metrics is available 48-96 hours after online publication and is updated daily on week days.
Initial download of the metrics may take a while.