Fig. 5
Download original image
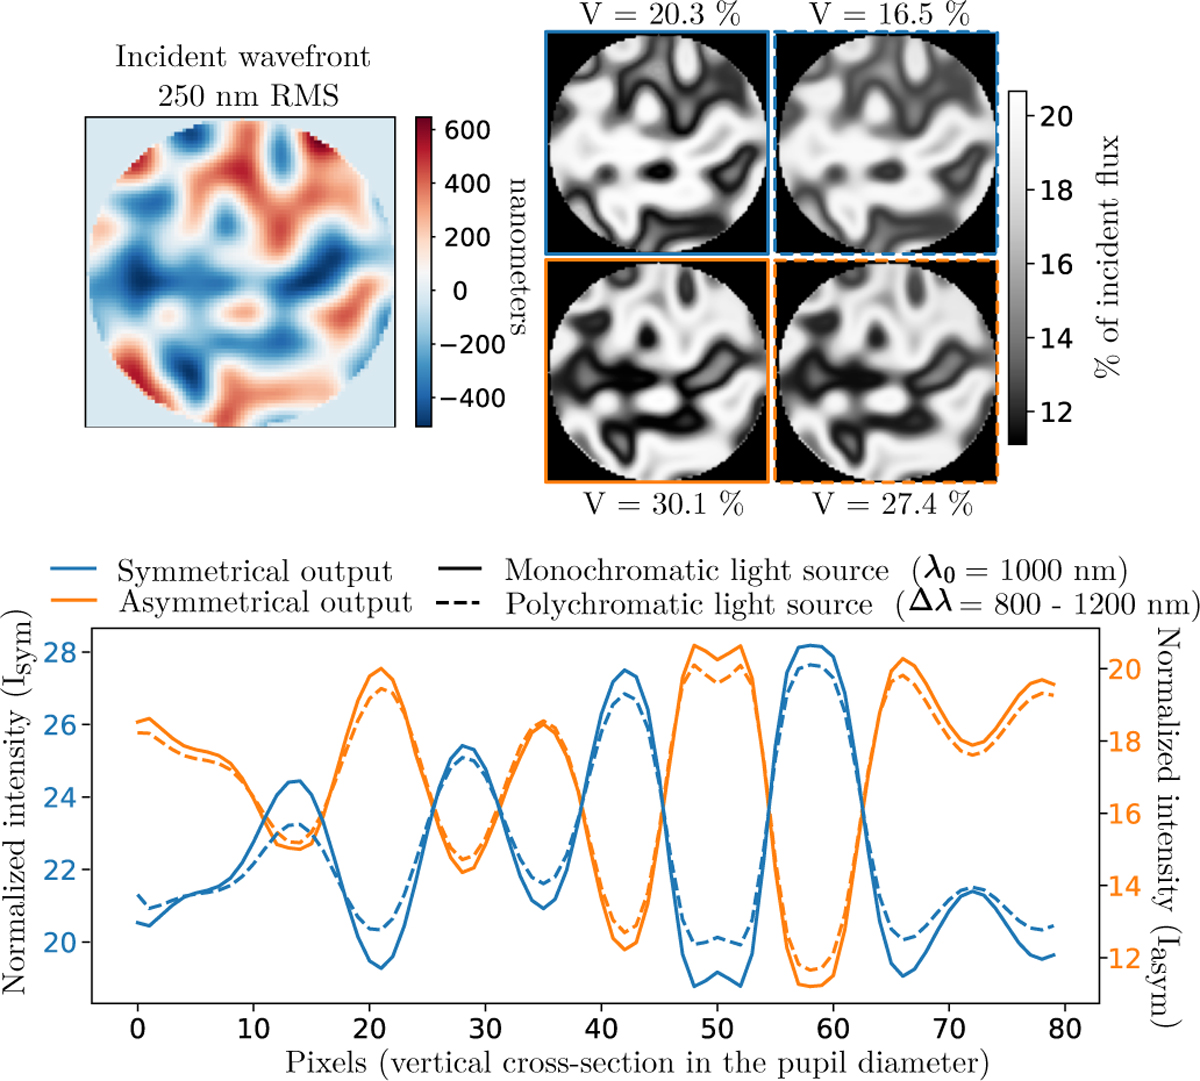
Noise-free simulation of iMZ response for a monochromatic (1000 nm) and broadband (800–1200 nm uniformly cut into 11 intervals 40 nm wide) light source, for an input aberration of 250 nm RMS (top left). The flux is 10 photons/pixel for each spectral interval (hence 11 times more photons in total for the broadband source compared to the monochromatic one). The interferograms’ intensities are displayed as a percentage of the incident flux. Top left: random incident wavefront phase produced by the DM actuators. Top right: interferograms obtained for each iMZ output (symmetrical in blue, asymmetrical in orange), monochromatic (solid line) and polychromatic (dotted line). Bottom: vertical section through the pupil diameter of the four interferograms. The visibility was calculated as V = (Imax - Imin)/(Imax + Imin), with Imin and Imax the minimal and maximal intensities measured in the image of the pupil.
Current usage metrics show cumulative count of Article Views (full-text article views including HTML views, PDF and ePub downloads, according to the available data) and Abstracts Views on Vision4Press platform.
Data correspond to usage on the plateform after 2015. The current usage metrics is available 48-96 hours after online publication and is updated daily on week days.
Initial download of the metrics may take a while.