Fig. 3.
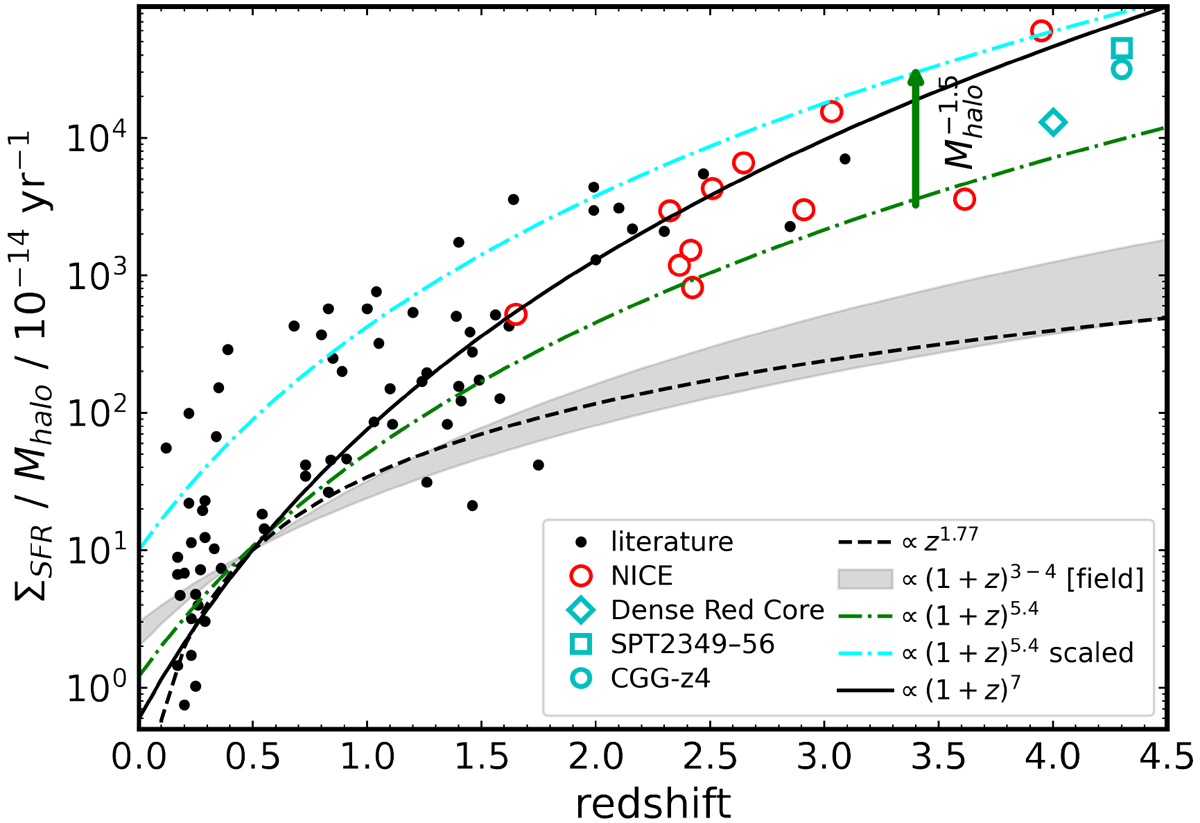
Download original image
Total SFR per unit halo mass as a function of redshift. Shown as red circles are the eight massive protoclusters in the COSMOS field and LH-SBC3 at z = 3.95, the most distant protocluster identified in the NICE survey (Zhou et al. 2024), as well as two other prototypes within the NICE survey, RO1001 at z = 2.91 (Kalita et al. 2021) and CL J1001 at z = 2.51 (Wang et al. 2018). Two other starbursting protoclusters, SPT2349-56 at z = 4.3 (Hill et al. 2022) and Distant Red Core at z = 4.0 (Long et al. 2020), are shown as a cyan square and diamond, respectively. CGG-z4, a compact galaxy group at z = 4.3 in the COSMOS field (Brinch et al. 2025), is shown as a cyan circle. The black dots and the curves show the (proto)clusters and redshift evolution compiled in Alberts & Noble (2022). The (proto)cluster data are drawn from Haines et al. (2013), Santos et al. (2014, 2015), Popesso et al. (2015a,b), Ma et al. (2015), Alberts et al. (2014, 2016), Casey (2016), Strazzullo et al. (2018), Smith et al. (2019), Lacaille et al. (2019). The black dashed line shows a redshift evolution trend ∝z1.77 (Popesso et al. 2011), while the green dash-dotted line indicates a ∝(1 + z)5.4 relation (Alberts et al. 2014; Webb et al. 2013; Bai et al. 2009). The cyan dash-dotted line also follows the ∝(1 + z)5.4 trend, but is scaled from logM200/M⊙ = 14.5 to 14, assuming ΣSFR/![]() (Webb et al. 2013). The solid line shows a steeper evolution of ∝(1 + z)7 (Cowie et al. 2004; Geach et al. 2006; Biviano et al. 2011), normalized at z = 0.5. For field galaxies, the gray shaded region represents the redshift evolution trend of ∝(1 + z)3 − 4 based on Le Floc’h et al. (2005), Rujopakarn et al. (2010), Sargent et al. (2012), Ilbert et al. (2015).
(Webb et al. 2013). The solid line shows a steeper evolution of ∝(1 + z)7 (Cowie et al. 2004; Geach et al. 2006; Biviano et al. 2011), normalized at z = 0.5. For field galaxies, the gray shaded region represents the redshift evolution trend of ∝(1 + z)3 − 4 based on Le Floc’h et al. (2005), Rujopakarn et al. (2010), Sargent et al. (2012), Ilbert et al. (2015).
Current usage metrics show cumulative count of Article Views (full-text article views including HTML views, PDF and ePub downloads, according to the available data) and Abstracts Views on Vision4Press platform.
Data correspond to usage on the plateform after 2015. The current usage metrics is available 48-96 hours after online publication and is updated daily on week days.
Initial download of the metrics may take a while.