Fig. 4.
Download original image
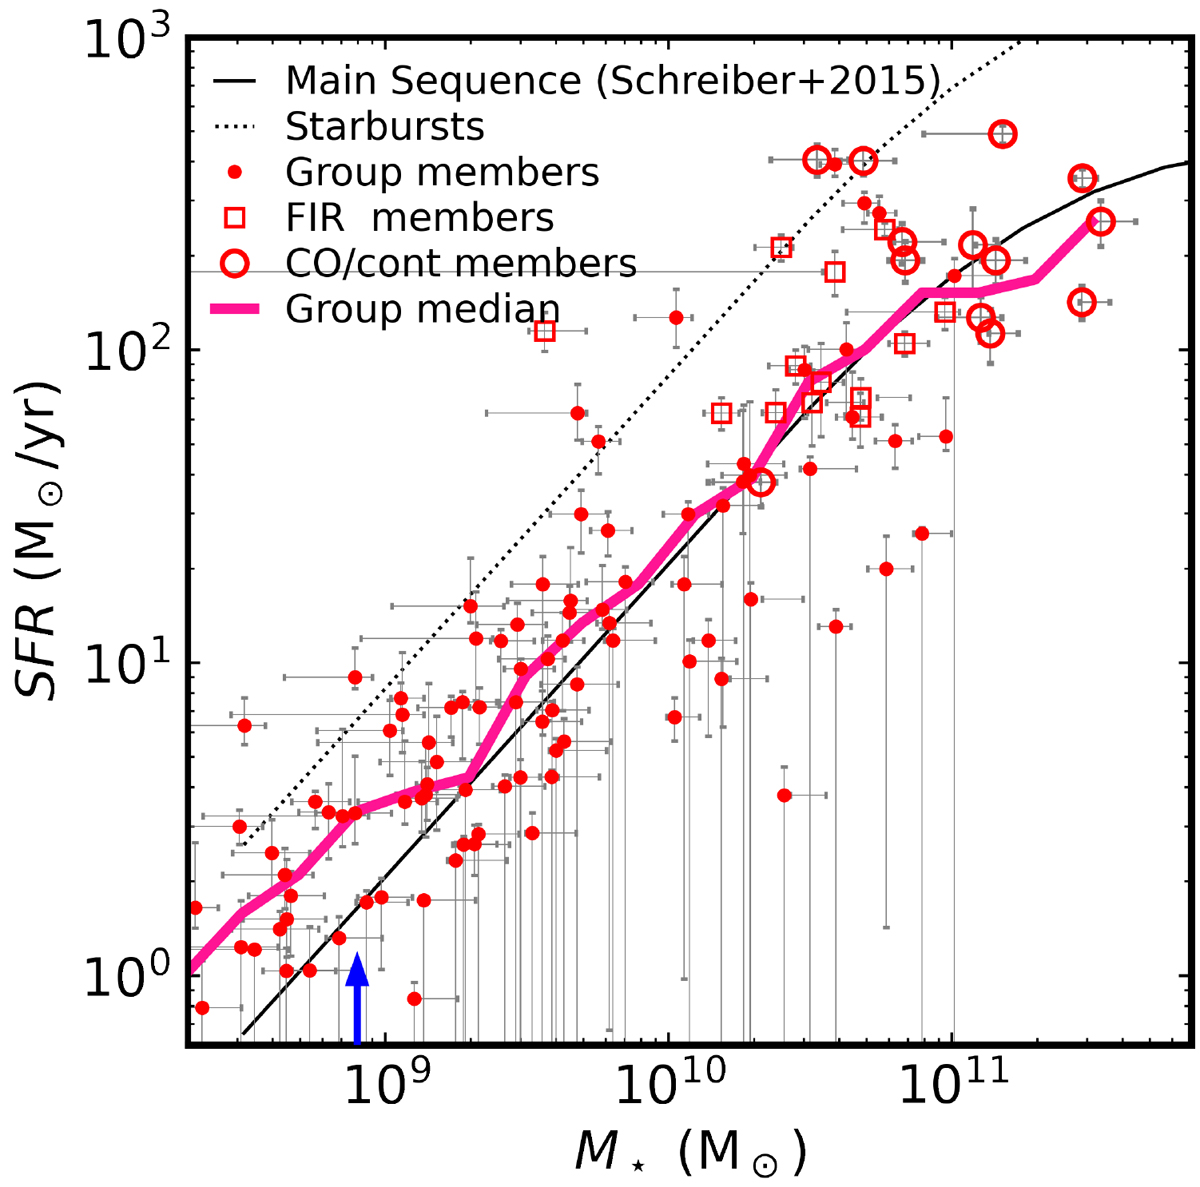
Star-forming main sequence of galaxy members in the eight protoclusters within NICE-COSMOS. CO-detected and dust continuum-detected members are highlighted with open red circles, while other FIR-detected galaxies are marked with open red squares. The remaining cluster members are represented as red dots. To enable comparison, the galaxies are scaled to a common redshift of z = 2.5, using the SFMS normalization and redshift evolution from Schreiber et al. (2015). The SFRs of FIR-detected members are derived from 3 GHz radio emission or 24 μm fluxes, while the SFRs for the rest are obtained from COSMOS2020 (see Section 2.2 for details). The pink curve represents the median SFR of member galaxies within the NICE-COSMOS protoclusters. For reference, the black solid curve shows the main sequence at z = 2.5 from Schreiber et al. (2015), and the dotted curve indicates the starburst regime, defined as RSB = 4 (Rodighiero et al. 2011). The blue arrow indicates the mass completeness limit of star-forming galaxies at z = 2.5 from COSMOS2020 (Weaver et al. 2022).
Current usage metrics show cumulative count of Article Views (full-text article views including HTML views, PDF and ePub downloads, according to the available data) and Abstracts Views on Vision4Press platform.
Data correspond to usage on the plateform after 2015. The current usage metrics is available 48-96 hours after online publication and is updated daily on week days.
Initial download of the metrics may take a while.