Fig. 6.
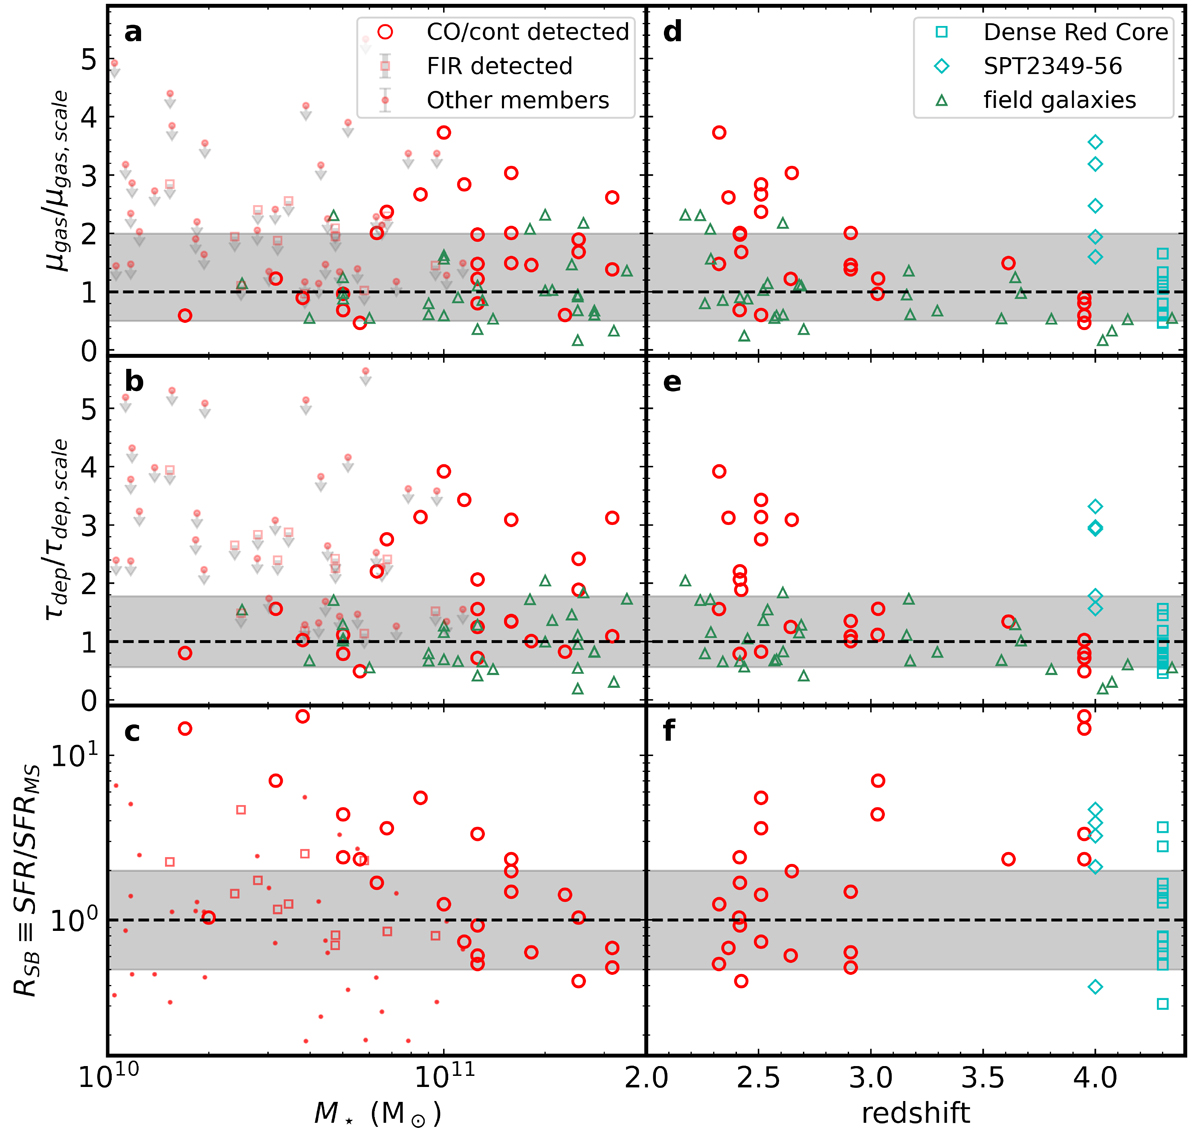
Download original image
Gas-to-stellar mass ratio (μgas = Mgas/M⋆), gas depletion time (τgas = Mgas/SFR), and starburstiness (RSB) as a function of stellar mass (left column) and redshift (right column). μgas and τgas are scaled relative to field galaxy levels (μgas, scale, τgas, scale), accounting for the stellar masses, redshifts, and starburstiness of each galaxy. The red circles represent galaxies detected in CO or dust continuum in the NICE protoclusters, including the eight in the COSMOS field (Sillassen et al. 2024), LH-SBC3 (Zhou et al. 2024), RO1001 (Kalita et al. 2021), and CL J1001 (Wang et al. 2018), while red squares and dots indicate the 3σ upper limits of those detected in the FIR and the rest of the cluster galaxies. Two additional starbursting protoclusters at z ≳ 4, SPT2349-56 (Hill et al. 2022) and Distant Red Core (Long et al. 2020), are shown in cyan. Field galaxies from Kaasinen et al. (2019), Boogaard et al. (2020), Frias Castillo et al. (2023) are represented as green triangles, with the molecular gas content derived from CO(1–0) emission lines. The black dashed lines denote the positions of field galaxies; the gray shading indicates the uncertainties.
Current usage metrics show cumulative count of Article Views (full-text article views including HTML views, PDF and ePub downloads, according to the available data) and Abstracts Views on Vision4Press platform.
Data correspond to usage on the plateform after 2015. The current usage metrics is available 48-96 hours after online publication and is updated daily on week days.
Initial download of the metrics may take a while.