Fig. 10
Download original image
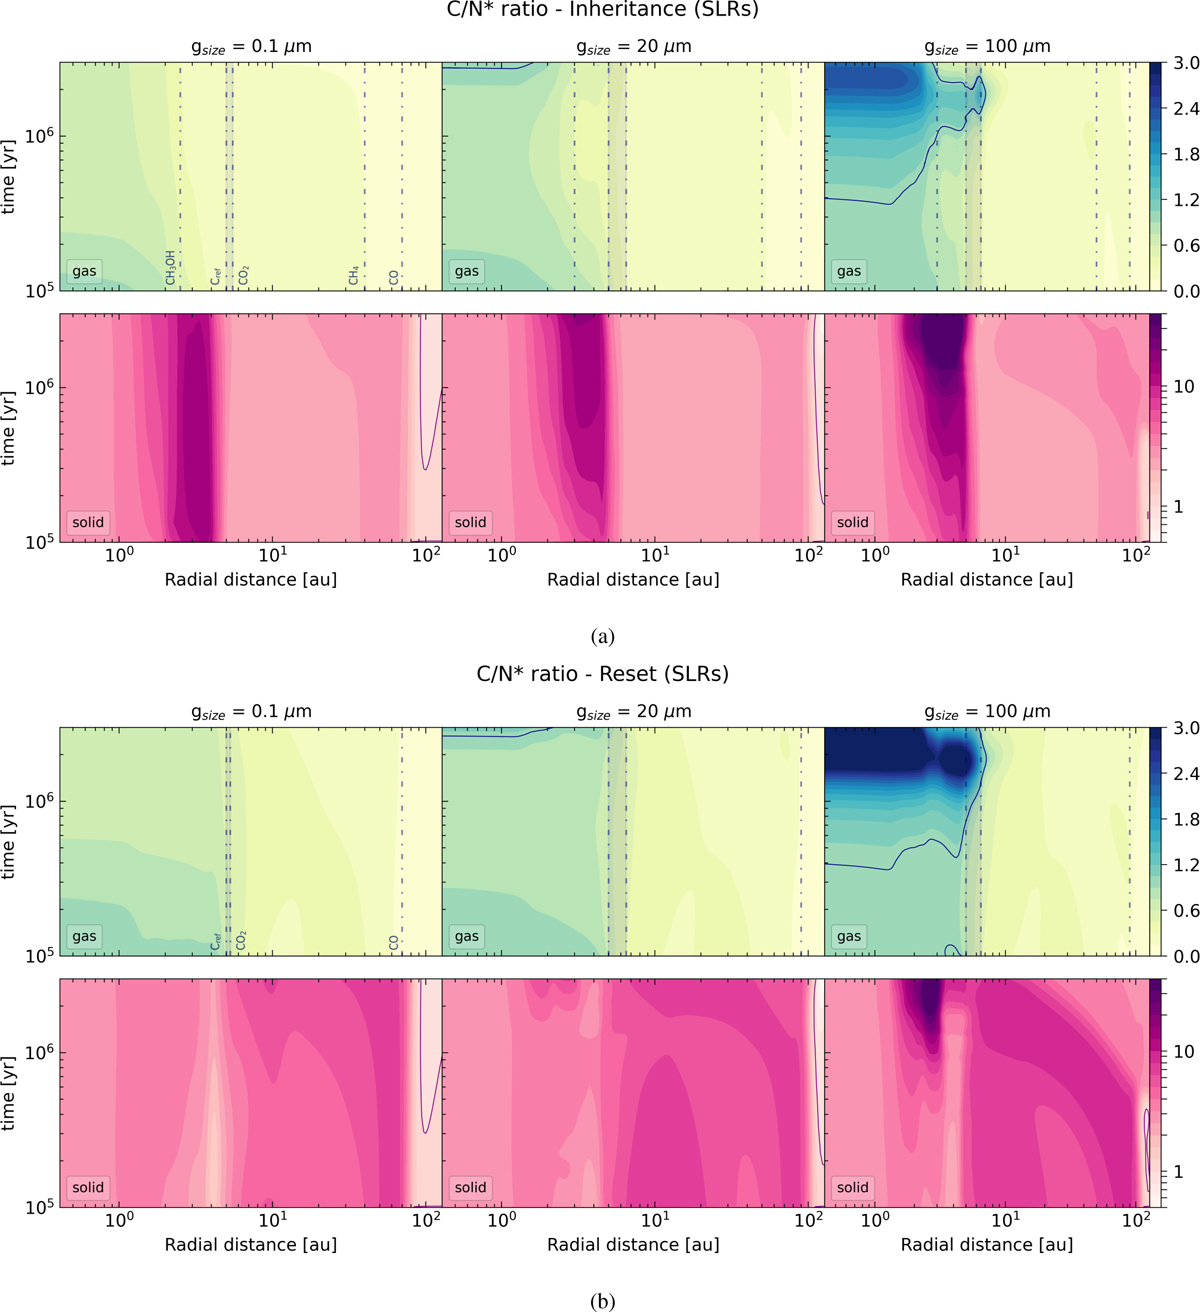
C/N ratio in the disc as a function of distance and time for the inheritance (panel a) and reset (panel b) scenarios with low ionisation. In each panel, the top row represents the gas phase, while the bottom row shows the solid phase (including rocks, ice mantles, and refractory organic carbon). All values are normalised to the stellar C/N ratio (∼4.27), with normalisation indicated by the superscript ∗. The dark contour represents a value of 1, corresponding to the stellar ratio. Vertical lines indicate the approximate locations of key snowlines at 2 Myr. Molecules are labelled only in the top-left plot of each panel but follow the same order in the other plots. For clarity, the NH3 snowline in either scenario is not shown, however, we note that it lies within the shaded region between the Cref and CO2 snowlines.
Current usage metrics show cumulative count of Article Views (full-text article views including HTML views, PDF and ePub downloads, according to the available data) and Abstracts Views on Vision4Press platform.
Data correspond to usage on the plateform after 2015. The current usage metrics is available 48-96 hours after online publication and is updated daily on week days.
Initial download of the metrics may take a while.