| Issue |
A&A
Volume 701, September 2025
|
|
|---|---|---|
| Article Number | A194 | |
| Number of page(s) | 28 | |
| Section | Planets, planetary systems, and small bodies | |
| DOI | https://doi.org/10.1051/0004-6361/202554012 | |
| Published online | 15 September 2025 | |
Planet formation in chemically diverse and evolving discs
I. Composition of planetary building blocks
1
INAF Istituto di Astrofisica e Planetologia Spaziali, Via Fosso del Cavaliere 100, 00133 Roma, Italy
2
INAF Osservatorio Astrofisico di Torino, Via Osservatorio 20, 10025 Pino Torinese, Italy
3
Institut für Theortische Astrophysik, Universität Heidelberg, Zentrum für Astronomie, Albert-Ueberle-Str 2, 69120 Heidelberg, Germany
4
School of Physics and Astronomy, University of Leeds, Woodhouse Lane, Leeds LS2 9JT, UK
5
Université Paris-Saclay, Université Paris Cité, CEA, CNRS, AIM, 91191 Gif-sur-Yvette, France
6
Interdisziplinäres Zentrum für Wissenschaftliches Rechnen, Universität Heidelberg, Im Neuenheimer Feld 225, 69120 Heidelberg, Germany
7
Harvard-Smithsonian Center for Astrophysics, 60 Garden Street, Cambridge, MA 02138, USA
8
Elizabeth S. and Richard M. Cashin Fellow at the Radcliffe Institute for Advanced Studies at Harvard University, 10 Garden Street, Cambridge, MA 02138, USA
9
INAF – Osservatorio Astronomico di Trieste, via G. B. Tiepolo 11, 34143 Trieste, Italy
10
ICSC – National Research Centre for High Performance Computing, Big Data and Quantum Computing, Via Magnanelli 2, 40033 Casalecchio di Reno, Italy
11
Dipartimento di Fisica e Astronomia “Augusto Righi”, Viale Berti Pichat 6/2, Bologna, Italy
12
INAF – Osservatorio Astrofisico di Arcetri, Largo E. Fermi 5, 50125 Firenze, Italy
★ Corresponding author: This email address is being protected from spambots. You need JavaScript enabled to view it.
Received:
3
February
2025
Accepted:
20
June
2025
Abstract
Protoplanetary discs are dynamic environments where the interplay between chemical processes and mass transport shapes the composition of gas and dust available for planet formation. We investigate the combined effects of volatile chemistry (including both gas-phase and surface reactions), viscous gas evolution, and radial dust drift on the composition of planetary building blocks. We explore scenarios of chemical inheritance and reset under varying ionisation conditions and dust grain sizes in the submillimetre regime. We simulated the disc evolution using a semi-analytical 1D model that integrates chemical kinetics with gas and dust transport, accounting for viscous heating, turbulent mixing, and refractory organic carbon erosion. We find that mass transport plays a role in the chemical evolution of even sub-μm grains, especially in discs that have experienced strong heating or are exposed to relatively high levels of ionising radiation. The radial drift of relatively small (~100 μm) icy grains can yield significant volatile enrichment in the gas phase within the snowlines, increasing the abundances of species like H2O, CO2, and NH3 by up to an order of magnitude. Early planetesimal formation can lead to volatile depletion in the inner disc on timescales shorter than 0.5 Myr, while the erosion of refractory organic carbon can lead to markedly superstellar gas-phase C/O and C/N ratios. Notably, none of the analysed scenarios were able to reproduce the classical monotonic radial trend of the gas-phase C/O ratio predicted by early models. Our results also show that a pairwise comparison of elemental ratios, in the context of the host star’s composition, is key to isolating signatures of different scenarios in specific regions of the disc. We conclude that accurate models of planet formation must concurrently account for the chemical and dynamical evolution of discs, as well as the possible diversity of their initial chemical and physical conditions.
Key words: astrochemistry / planets and satellites: composition / planets and satellites: formation / protoplanetary disks / planetary systems
© The Authors 2025
 Open Access article, published by EDP Sciences, under the terms of the Creative Commons Attribution License (https://creativecommons.org/licenses/by/4.0), which permits unrestricted use, distribution, and reproduction in any medium, provided the original work is properly cited.
This article is published in open access under the Subscribe to Open model. This email address is being protected from spambots. You need JavaScript enabled to view it. to support open access publication.
1 Introduction
The remarkable advances in observational astronomy over the past decade have profoundly transformed our understanding of the conditions and processes driving planet formation in proto-planetary discs. The morphology and composition of discs have been characterised down to scales of less than 10 au, revealing a high occurrence of substructures and rich gas- and ice-phase chemistry (e.g. Andrews et al. 2018; Öberg et al. 2021; McGuire 2022; Kamp et al. 2023; McClure et al. 2023; Sturm et al. 2023; Öberg et al. 2023; Manara et al. 2023). Observations also include discs hosting confirmed protoplanets in the final stages of their formation (e.g. Perotti et al. 2023). Simultaneously, detailed spectroscopic characterisations of planetary atmospheres across a large sample of exoplanets have revealed the presence of both volatile and refractory species (e.g. Giacobbe et al. 2021; Changeat et al. 2022; Guilluy et al. 2022; Carleo et al. 2022; Tsai et al. 2023; Edwards et al. 2023).
Access to the chemical composition of both protoplanetary discs and planetary atmospheres allows for a direct comparison of their elemental abundance ratios, which has long been recognised as a key diagnostic for planet formation processes (see Madhusudhan 2019, for a review). Since the seminal work by Öberg et al. (2011), the carbon-to-oxygen (C/O) ratio has received particular attention. In discs, thermal freeze-out drives phase transitions at the snowlines of the major volatile carriers of oxygen and carbon (H2O, CO2, and CO), resulting in radial variations in the C/O ratio of both gas and solids. These variations have motivated the development of a diagnostic framework to link the C/O ratios in planetary atmospheres to the formation locations of planets within the disc (e.g. Madhusudhan et al. 2014, 2017; Mordasini et al. 2016). However, recent models have demonstrated that early implementations of this approach, while conceptually insightful, tend to oversimplify the complex physical, dynamical, and chemical evolution of protoplanetary discs suggested by observations (e.g. Bergin et al. 2016; Krijt et al. 2020; Bosman et al. 2021; Bergner et al. 2024).
Beyond the temperature, other key parameters influencing disc chemistry include the density, ionisation rate, and chemical initial conditions (e.g. Henning & Semenov 2013). Variations in these factors can drive the conversion of abundant species into molecules with different volatilities, altering the elemental ratios of gas and solids within the disc. A central unresolved question is whether discs inherit the molecular composition of their parent molecular cloud or undergo a chemical reset during collapse and disc formation (e.g. Öberg & Bergin 2021). Each scenario leads to significantly different chemical outcomes, with direct effects on both disc chemistry (Eistrup et al. 2016, 2018) and the composition of planetary atmospheres (Pacetti et al. 2022).
Volatiles, however, account for only part of the picture. A growing body of evidence from the interstellar medium (ISM), comets, meteorites, circumstellar discs, and polluted white dwarfs points to a more complex partitioning of elements, involving significant contributions from refractory and semirefractory phases (e.g. Bardyn et al. 2017; Altwegg et al. 2020). A long-standing issue in Solar System formation is the observed deficit of solid carbon, particularly in the Earth and the inner Solar System (Lee et al. 2010; Li et al. 2021). This “missing carbon” problem can be explained by recognising that up to half of the cosmic carbon budget is sequestered in semi-refractory organic materials (Gail & Trieloff 2017; van’t Hoff et al. 2020). These compounds, embedded in icy grains, can be transported inwards and thermally processed in the inner disc, where they enrich the gas phase upon sublimation (e.g. Houge et al. 2025). Cometary C/Si ratios comparable to those of interstellar dust (Savage & Sembach 1996; Rubin et al. 2019) suggest that these organics are inherited from earlier evolutionary stages. In contrast, meteorite classes (carbonaceous, ordinary, and enstatite chondrites) exhibit a systematic decline in carbon content with decreasing formation distance from the Sun (Allègre et al. 2001; Bergin et al. 2015), consistent with the progressive erosion of refractory organics in the inner disc. Similar trends are observed in exoplanetary systems: polluted white dwarfs display strongly subsolar C/Fe and C/Si ratios, indicative of the accretion of carbon-poor, asteroidal material (Jura 2006; Jura et al. 2012; Gänsicke et al. 2012; Farihi et al. 2016). Together, these findings suggest that the redistribution and erosion of refractory carbon is a common outcome of disc evolution and planet formation (Nazari et al. 2023).
These considerations are particularly relevant given that exoplanet formation is often modelled assuming solar-like native environments. However, homogeneous spectroscopic surveys of stars in the solar neighbourhood reveal significant compositional diversity, with trends in stellar metallicity and elemental ratios (e.g. Magrini et al. 2022; Biazzo et al. 2022; da Silva et al. 2024; Filomeno et al. 2024). Consequently, the Sun does not necessarily provide a representative chemical template for all planetary systems (Teske 2024), emphasising the importance of interpreting disc and exoplanet compositions in the context of their specific stellar environment (Turrini et al. 2021; Pacetti et al. 2022).
Finally, disc dynamics plays a critical role in shaping the spatial and temporal distribution of chemical species. Protoplan-etary discs serve as mass transport channels, with gas accreting onto the central star and dust evolving under the influence of gas drag, radial drift, and turbulent mixing (Lynden-Bell & Pringle 1974; Shakura & Sunyaev 1973; Weidenschilling 1977; Youdin & Lithwick 2007; Birnstiel et al. 2010). These processes shift the location of snowlines and influence volatile delivery to the inner disc (e.g. Dodson-Robinson et al. 2009; Piso et al. 2015). In particular, radial drift of icy pebbles has been extensively studied for millimetre- to centimetre-sized pebbles and has been shown to enhance gas-phase volatile abundances by releasing ices near snowlines (e.g. Cuzzi & Zahnle 2004; Öberg & Bergin 2016; Booth et al. 2017; Booth & Ilee 2019; Schneider & Bitsch 2021a,b). Observational evidence for such enhancements has emerged in multiple discs, attributed to pebble drift (e.g. Zhang et al. 2019; Banzatti et al. 2020, 2023; Perotti et al. 2023; Mah et al. 2023; Schwarz et al. 2024), the erosion of refractory organic carbon (e.g. Tabone et al. 2023; Kanwar et al. 2024), or trapping mechanisms beyond snowlines (e.g. van der Marel et al. 2021).
Disc evolution can reshape the composition of planetforming material on timescales of a few million years, comparable to those of planet formation (e.g. Eistrup et al. 2018; Booth & Ilee 2019). Models incorporating more realistic treatments of disc chemistry have shown that the planetary C/O ratio cannot always be unambiguously linked to a specific formation scenario (e.g. Cridland et al. 2019; Turrini et al. 2021; Pacetti et al. 2022). This degeneracy can be partially resolved by adopting a multi-element approach that includes elements with a range of volatilities, which provide complementary constraints on disc chemistry and planet formation pathways (e.g. Öberg & Wordsworth 2019; Cridland et al. 2017, 2020; Schneider & Bitsch 2021b; Turrini et al. 2021; Pacetti et al. 2022; Chachan et al. 2023; Crossfield 2023; Danti et al. 2023). For example, Turrini et al. (2021) investigated fingerprints of planet formation in the atmospheric abundances of C, O, N, and S in giant planets. Their study assumed a stationary disc structure but incorporated a detailed compositional model with volatiles inherited from the molecular cloud and refractory materials calibrated using data from the Solar System and extrasolar systems. In Pacetti et al. (2022), we extended this framework by exploring the effects of different initial chemical conditions in the disc, including scenarios of chemical reset and exposure to ionising radiation.
This paper is the first in a two-part series that builds on the work of Turrini et al. (2021) and Pacetti et al. (2022) to investigate the effects of disc evolution on the composition of planet-forming material and the atmospheres of giant planets. In this study, we focus on the disc itself, exploring how different initial chemical conditions and dust grain sizes influence the abundances of volatile molecules and the C/O, C/N, and N/O ratios. Compared to previous models of coupled chemical and dynamical evolution (e.g. Eistrup et al. 2018; Cridland et al. 2017; Booth & Ilee 2019; Cevallos Soto et al. 2022), our work introduces two key extensions: a more realistic treatment of the initial volatile composition and its evolution – including the erosion of semi-refractory organic carbon – along with planetesimal formation as a sink for volatiles. We specifically examine submillimetre-sized grains, considering a range of grain sizes smaller than those typically assumed for pebbles in discs.
We introduce our time-dependent disc model and its numerical implementation in Sect. 2. We then present our results for a stationary disc, where we consider chemical processes but exclude mass transport (Sect. 3). Next, we examine the effects of different grain sizes on the radial distribution of gas and dust in the midplane (Sect. 4) before exploring the chemical outcomes of our full model under various gas–dust coupling regimes and chemical scenarios (Sect. 5). Finally, we analyse how disc evolution shapes the elemental ratios of carbon, oxygen, and nitrogen (Sects. 6 and 6.4).
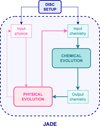 |
Fig. 1 Flowchart showing the initialisation of JADE and the operations performed in a single iteration of the code, following an operatorsplitting scheme. |
2 Methods
We modelled the planet formation environment by focussing on the midplane (z = 0) of a Class II protoplanetary disc consisting of gas, dust, and planetesimals. The disc evolves as a result of the combined effects of chemical interactions and mass transport. The physical (Sect. 2.1) and chemical (Sect. 2.2) models of the disc were numerically integrated into our new code JADE (Joint Astrochemistry and Disc Evolution). The code uses an operatorsplitting scheme to evolve the disc, solving the chemistry and physics sequentially at each time step (Fig. 1).
We employed JADE to investigate how the composition of the planet-forming material changes when disc evolution is considered. We explored four chemical scenarios (two sets of initial abundances and two ionisation levels) and three populations of dust grains, resulting in twelve simulations that run for 3 Myr, with a fixed time step of dt = 103 yr for both the physical and chemical modules. We note that while some chemical reactions in the disc midplane might occur on shorter timescales (e.g. Semenov & Wiebe 2011), numerical experiments with smaller time steps down to 10 yr in the scenario with the most efficient dust transport (100 μm-sized grains) showed that differences in the gas-phase abundances of key volatile carriers remain below 10%. This confirms that the adopted time step of 103 yr does not significantly affect the global abundance trends nor the conclusions of this work.
2.1 Disc physical model
We considered an axisymmetric, geometrically thin (z ≪ r), and non-self-gravitating disc accreting onto a star with solar mass, radius, and luminosity. The model accounts for viscous gas spreading as well as the effects of gas drag, radial drift, and turbulent mixing on the dust’s dynamical evolution. The midplane temperature is set by both viscous heating and stellar irradiation. Further details are provided in the following subsections.
The initial disc structure (Sect. 2.1.1) and its evolution (Sect. 2.1.2) were modelled using the DISKLAB package1. We set up the disc on a 1D radial grid consisting of 600 logarithmically spaced points from 10-2 au up to 106 au to avoid numerical instabilities, with 300 grid points sampling the first 100 au.
2.1.1 Initial disc structure
We initialised the gas surface density profile using the analytical solution for a viscous disc by Lynden-Bell & Pringle (1974):
![Mathematical equation: \Sigma_{\rm g}(r)=\Sigma_{\rm c}\left(\dfrac{r}{R_{\rm c}}\right)^{-\gamma}\exp\left[-\left(\dfrac{r}{R_{\rm c}}\right)^{\left( 2-\gamma \right)}\right],](/articles/aa/full_html/2025/09/aa54012-25/aa54012-25-eq1.png) (1)
(1)
where we set Rc = 165 au and γ = 0.8 based on the observed gas surface density profile of the disc surrounding HD 163296, one of the best-characterised protoplanetary discs to date (Isella et al. 2016). The normalisation constant, Σc = 3.3835 g cm-2, is chosen to yield a total disc mass of 0.054 M⊙, consistent with the mass of a minimum mass solar nebula (MMSN, Hayashi 1981) with a similar radial extent (Turrini et al. 2021; Pacetti et al. 2022).
Overall, Rc values larger than ∼100–150 au align with expectations for viscously evolving discs (e.g. Rosotti et al. 2019) and are supported by ALMA observations. Specifically, millimetre continuum data suggest dust disc radii between 10 and 500 au in a sample of approximately 200 Class II discs (Andrews 2020, and references therein), while CO emission lines reveal gas extending up to 500 au in 22 Lupus discs (Ansdell et al. 2018).
We assumed that the disc is non-self-gravitating and has a vertically isothermal structure in hydrostatic equilibrium, following the descriptions by Nakamoto & Nakagawa (1994), Hueso & Guillot (2005), and Birnstiel et al. (2010). Under these assumptions, the speed of sound, cs, does not vary with height above the midplane (see also Sect. 2.1.3) and the gas surface density is related to the midplane number density of gas particles, nmid, via
 (2)
(2)
where Hp is the pressure scale height of the disc, defined as Hp = cs ∕Ωk, with  , where G is the gravitational constant and M* is the mass of the central star. The quantity μg is the mean molecular weight of the gas in units of the proton mass mp. In JADE, this value is computed self-consistently at each iteration by averaging the molecular weights of the individual gas species, weighted by their fractional abundance.
We derived the initial surface density of the dust assuming a constant dust-to-gas ratio of 0.01, equal to the canonical value for the ISM (Bohlin et al. 1978). The initial gas and dust profiles are shown as part of Fig. 4. The gas surface density decreases from 400 g cm-2 at 0.4 au to 1.2 g cm-2 at Rc. Over this range, the number density of gas particles decreases from 1014 cm-3 to 108 cm-3.
2.1.2 Transport of gas and dust
We adopted the Shakura–Sunyaev α-prescription and parametrised the gas viscosity as ν = α cs Hp, where α quantifies the strength of Shakura & Sunyaev (1973). Observational evidence suggests low turbulence levels with α ≲ 10-3 (e.g. Flaherty et al. 2015, 2018; Rosotti 2023). We assumed α to be constant and uniform in the disc, adopting a value of 10-3.
The viscous evolution of an axisymmetric and geometrically thin α-disc is described by the following 1D diffusion equation for the time evolution of Σg(r, t) as follows (Lynden-Bell & Pringle 1974):
 (3)
(3)
where Sg is the source term that represents a possible external inflow or outflow of gas and vg is the radial velocity of the gas particles given by the conservation of angular momentum:
 (4)
(4)
We set Sg = 0, as Class II discs have dispersed their surrounding envelope, and late infall is expected to be negligible in the absence of gravitational interactions with nearby clouds (Gupta et al. 2023).
The viscous accretion timescale is given by tvisc = r2 ∕ν. Considering only the contribution of stellar irradiation to the midplane temperature (see Sect. 2.1.3), which in our disc model results in a temperature profile T ∝ r-1/2 with T = 157 K at 1 au, this becomes (see also Booth & Ilee 2019):
 (5)
(5)
corresponding to a viscous timescale of ~10 Myr at the radius, Rc. Equation (5) provides an upper limit to the viscous timescale in the inner disc, where viscous dissipation raises the temperature and accelerates the evolution.
We followed Birnstiel et al. (2010) in modelling the evolution of dust grains, taking into account their aerodynamic coupling with the turbulent gas, characterised by their Stokes number St (Youdin & Lithwick 2007), and assumed that the gas diffusivity is equal to the gas viscosity ν. The surface density profile of the dust component, Σd(r, t), then evolves in time according to the advection-diffusion equation:
 (6)
(6)
where vd is the radial velocity of the dust and Dd is the dust diffusivity, both of which depend on St:
 (7)
(7)
with  being the gas pressure at the midplane. The source term Sd in Eq. (6) accounts for dust production and destruction. Since we focussed on the radial transport of dust and did not model coagulation or fragmentation processes, we set Sd = 0 at each time step during the disc evolution. Furthermore, we assumed that the dust had already settled in the midplane at the beginning of our simulations (see Sect. 8).
We numerically solved Eqs. (3) and (6) using the fully implicit integration scheme from Birnstiel et al. (2010), implemented within DIS KLAB. The algorithm calculates the flux of gas and dust across the grid cells, tracking the transport of material throughout the disc over time.
For dust particles, we assumed spherical grains with a fixed bulk density, ρd = 2.5 g cm-3. This value is physically consistent with the density of CI chondrites or that of a dust-ice mixture with decreased porosity (Consolmagno et al. 2008). We considered three dust grain sizes: 0.1, 20, and 100 μm. The smallest size represents submicrometre dust grains that are strongly coupled to the gas, similar to those found in the diffuse ISM (Mathis et al. 1977). At densities higher than those in the ISM, however, dust coagulation favours the formation of much larger grains (e.g. Weidenschilling & Cuzzi 1993; Dullemond & Dominik 2005; Isella et al. 2010; Tazzari et al. 2016; Lebreuilly et al. 2023; Marchand et al. 2023). The second and third sizes were chosen within the size range (10-100 μm) for dust grains during the early phases of star and protoplanetary disc formation predicted by Bate (2022). We considered a single grain size in each simulation to better quantify its impact on the evolution of the disc composition.
Depending on the local temperature and density conditions in the disc, dust grains exist either in a bare form or coated with ice from the condensation of volatile molecules. As the disc evolves, icy grains undergo local diffusion and mixing. To track the radial redistribution of individual ice species (e.g. H2O, CO2, NH3), we treated each as a separate, independent dust component and assumed that they undergo the same dynamical evolution – i.e. we neglected the contribution of the volatile coating to the particle’s Stokes number. The surface density of each ice species was then evolved independently using an advection-diffusion equation analogous to Eq. (6):
 (8)
(8)
where i = 1,..., 184 corresponds to the number of ice species included in our model. Since all species share the same dynamics, summing the solutions of Eq. (8) over all i is numerically equivalent to solving Eq. (6) for the total surface density of ice, defined as the sum of contributions from all ice species.
Since the diffusion coefficient approaches the turbulent gas diffusivity in the limit St → 0, Eq. (6) also applies to the advection and diffusion of gas particles. Following the same approach as for icy grains, we tracked the radial transport of individual volatile species in the gas phase by solving equations analogous to Eq. (8), with the index i running over the 484 gas-phase species included in our model. For gas particles, we adopted a nominal size of 10-10 cm to ensure tight coupling.
To better interpret the temporal changes in the chemical composition of the disc due to mass transport, it is useful to estimate the radial drift timescale, tdrift = r∕vd, for a dust grains of size a. We adopted the parametrisation from Booth & Ilee (2019):
 (9)
(9)
This expression is rigorously valid for a density structure where Σg ∝ r-1, slightly steeper than the one adopted in this work. However, it still provides a useful approximation for a qualitative analysis of the numerical solution (Sect. 5).
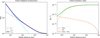 |
Fig. 2 Left: initial radial profile of the midplane temperature (solid) together with the contributions of stellar irradiation (dashed) and viscous heating (dash-dotted). The temperature reaches a minimum value of 10 K in the outer disc. Right: initial ionisation profiles in the midplane. The orange (dash-dotted) curve indicates the contribution of SLRs and characterises the ionisation environment in the low scenario. The green (solid) curve shows the total ionisation taking into account an additional contribution from CRs (light green curve) and characterises the ionisation environment in the high scenario. |
2.1.3 Midplane temperature
To account for the feedback of disc evolution on the midplane temperature, we considered two primary heating mechanisms: the reprocessing of stellar irradiation and the internal energy dissipation from viscous accretion (D’Alessio et al. 2005). Together, these mechanisms contribute to the midplane temperature structure as follows:
 (10)
(10)
where Tirr and Tvisc represent the contributions from stellar irradiation and viscous heating, respectively. To prevent the temperature in the outer disc from dropping to unphysically low values, we set a lower limit of 10 K wherever Tmid would otherwise fall below this threshold. This is consistent with the lowest midplane temperatures inferred for the disc around HD 163296 from CO line emission (Dullemond et al. 2020).
The irradiation temperature was calculated by balancing the heating from stellar irradiation with the radiative cooling of the disc, giving:
 (11)
(11)
where α(r) is the grazing angle between the incident stellar rays and the disc surface, σB is the Stefan–Boltzmann constant, and L⋆ is the stellar luminosity (Chiang & Goldreich 1997; Dullemond et al. 2001). For our geometrically thin, nonself-shadowed disc, we assumed that stellar light reaches the disc surface at a constant, shallow grazing angle of α ≪ 1. We adopted a global value of sin α ≈ α = 0.05.
The contribution of viscous heating to the midplane temperature was estimated following the approach of Nakamoto & Nakagawa (1994):
 (12)
(12)
where τRoss = Σd κd,Ross is the Rosseland mean optical depth, and κd,Ross is the Rosseland mean opacity of the dust. Solutions for Tvisc are calculated iteratively using Brent’s root-finding algorithm, assuming a constant dust opacity of κd,Ross = 103 throughout the disc and for all simulated grain sizes.
From Tmid, the sound speed is automatically calculated at each time step during the disc evolution and is given by
 (13)
(13)
where kB is the Boltzmann’s constant. The initial midplane temperature profile is shown in Fig. 2. In the inner disc, Tvisc dominates due to higher gas densities, whereas Tirr prevails in the outer disc. We assumed that the stellar luminosity remains constant at the present-day solar value over the timescale of our simulations, so that Tirr varies only with the distance from the star. In contrast, Tvisc evolves over time due to changes in the surface density.
2.1.4 Ionisation environment
We modelled the ionisation environment of the disc midplane following the same approach as in Eistrup et al. (2016) and Pacetti et al. (2022). We considered two scenarios with low and high ionisation levels.
In the low scenario, the only source of ionising radiation in the midplane is the decay of short-lived radionuclides (SLRs). The associated ionisation rate per H2 molecule was parametrised as follows (Cleeves et al. 2013):
 (14)
(14)
In the high scenario, ionisation from SLRs is enhanced by an additional contribution from external cosmic rays (CRs), taken as the standard cosmic-ray ionisation rate,  (Spitzer & Tomasko 1968), attenuated by the gas surface density (Umebayashi & Nakano 1981; Eistrup et al. 2016):
 (15)
(15)
The initial ionisation rates for the two scenarios are shown in Fig. 2.
Initial conditions for chemistry: elemental abundances with respect to total H nuclei in the initial gas mixture (protosolar), in rocks (meteoritic) and in the residual gas after condensation of rocks.
2.2 Disc chemical model
The compositional model of the disc builds upon the one presented by Pacetti et al. (2022), with updated reference abundances and a revised parametrisation of the radial abundance profile of refractory organic carbon.
2.2.1 Setting the initial conditions for chemistry
The disc model assumes that the planet-forming material is distributed across three reservoirs: rocks, volatiles (gas and ices), and refractory organic carbon. We determined the initial elemental abundances in these reservoirs starting from a protosolar gas mixture, following the approach of Pacetti et al. (2022).
The rocky component hosts all elements except the noble gases and includes a fraction of the total available H, C, O, and N, with the remainder of these elements considered to reside in volatile form (see below). We assumed that the rock-forming elements were originally present in meteoritic proportions in the protosolar mixture, adopting the meteoritic abundances of CI chondrites from Lodders (2010). We focussed on the elemental budget of the rocky component and did not model its specific mineralogy (e.g. silicates, carbonaceous compounds, or other refractory phases). Furthermore, following Palme et al. (2014) and Turrini (2023), we assumed a fixed composition for the rocky material and did not model the sublimation of its constituents at temperatures exceeding 300 K within the innermost 1 au (Fegley & Schaefer 2010).
For H, the noble gases He, Ne, and Ar, and the volatile fractions of C, O, and N, the initial abundances were estimated from the updated solar photospheric abundances of Asplund et al. (2021). We applied a correction factor to account for atomic diffusion, which causes elements heavier than H to partially settle out of the Sun’s outer convective zone into its radiative interior. Following Vinyoles et al. (2017) and Asplund et al. (2021), we adopted a correction factor of 0.07 dex for He. For C, O, N, Ne, and Ar, we used a correction factor of 0.03 dex, as predicted by the recent model of Eggenberger et al. (2022), which includes internal rotation and better reproduces Li depletion in the Sun and helioseismological constraints.
The protosolar and meteoritic abundances describing the original mixture are listed in Table 1, along with the abundances in the residual gas after condensation of the rock-forming elements. All abundances in this study are given with respect to the total number of H nuclei.
Based on Lee et al. (2010), Gail & Trieloff (2017), van’t Hoff et al. (2020), Li et al. (2021), and Nazari et al. (2023), we introduced an additional chemical species, Cref, to trace the evolution of refractory organic carbon. Similar to rocks, refractory organic carbon was treated as a reservoir for semi-refractory organic carbon, which remains inert throughout most of the disc and undergoes chemical processing only within its sublimation radius, where its volatile component returns to the gas phase. Following Mordasini et al. (2016) and Cridland et al. (2019), we modelled carbon erosion in the disc with a power-law abundance profile for Cref between 1 and 5 au:
 (16)
(16)
where Cref,min is set to 10-20 and Cref,max to 1.9 × 10⁻⁴, which corresponds to about 60% of the total carbon in the original protosolar mixture (see Tab. 1), consistent with the carbon content observed in Solar System comets (Bardyn et al. 2017). These boundary conditions yield a power-law index of c ~ 23.3. We treated Cref as a semi-refractory, carbon-bearing species transported by dust grains, with its initial abundance set by the profile in Eq. (16). Within 5 au, we assumed that Cref is released back into the gas phase as atomic carbon, following a complementary profile to that in Eq. (16). To simulate the advection and diffusion of Cref during disc evolution, we updated the abundance of atomic C in the gas phase at each time step by adding the fraction of Cref that had crossed 5 au and sublimated.
Overall, the refractory component of our disc contains approximately 50% of the protosolar O, ~68% of C (with 8% in rocks and 60% in Cref), and ~3% of N. The volatile component accounts for the remaining 50% of O, 32% of C, and 97% of N. Table 1 lists the total abundances of elements available for forming volatiles in the residual gas after the condensation of rocks. For C, this abundance decreases to approximately 9.1 × 10⁻⁵ beyond 5 au, where Cref remains in solid form.
We simulated the chemical evolution of the disc using two different sets of initial abundances for the volatile component, listed in Table 2 along with the adopted binding energies, EB (K). These two sets correspond to the ‘inheritance’ and ‘reset’ scenarios described in Eistrup et al. (2016, 2018) and Pacetti et al. (2022). In the inheritance scenario, C, O, and N are initially locked in seven key volatile molecules, representing a disc that has inherited its composition from the prestellar phase. We partitioned these elements into their seven major molecular carriers using the same molecular ratios as in Eistrup et al. (2016), which are representative of interstellar ice (Marboeuf et al. 2014; Boogert et al. 2015). In the reset scenario, by contrast, C, O, and N are initialised in their atomic form, representing an extreme case in which all molecules have been fully dissociated due to strong heating by the protostar. In both the inheritance and reset scenarios, the atomic carbon abundance reported in Table 2 applies to disc regions beyond 5 au. Inside 5 au, the C abundance is enhanced by the contribution of sublimated carbon from Cref , as described above.
Initial abundances of volatile species with respect to total H-nuclei in the inheritance and reset scenarios, together with their binding energies.
2.2.2 Chemical evolution of volatile molecules
The evolution of the abundances of volatile molecules in the disc midplane was calculated using the two-phase chemical kinetics code by Walsh et al. (2015). The chemical network used in this study consists of 668 species (gas + ice) participating in 8385 chemical reactions, which include gas-phase reactions, gas-grain interactions, and grain-surface chemistry. This corresponds to the ‘full chemical network’ used in Eistrup et al. (2016, 2018) and on which the disc chemical model of Pacetti et al. (2022) is also based. A detailed description of the chemical network can be found in Walsh et al. (2015) and Eistrup et al. (2016).
The high opacity of protoplanetary discs prevents stellar UV photons from penetrating deeper than the upper layers of the disc atmosphere. As a result, photochemistry in the midplane is strongly inhibited. To simulate this condition, we assumed a fixed extinction coefficient Av = 10 throughout the disc grid. UV photons can still be generated internally via the interaction of CRs with H2 molecules (Eistrup et al. 2016) and are responsible for photodesorption and CR-induced photoreactions. Following Eistrup et al. (2016, 2018), we neglected the contribution of X-rays and considered SLRs and CRs as the main ionisation sources in the midplane.
Dust grains actively participate in the chemical evolution by providing surfaces for adsorption and desorption processes. We assumed spherical grains with fixed radius and density (see Sect. 2.1.2), and used the radial dust surface density profile derived from the physical model to compute the abundance of grains relative to the total number of H nuclei at each location in the disc. This abundance was updated at each time step during the disc evolution. The grain size also determines the number of available sites for surface reactions, which in turn affects the efficiency of gas-grain interactions and surface chemistry. Large grains can host more reaction sites on their surface than small grains. However, due to their larger size, they are comparatively less abundant, which ultimately leads to less efficient grain chemistry (e.g. Navarro-Almaida et al. 2024).
We assumed thermal equilibrium between the gas and dust, which is expected in the disc midplane due to the high densities. Additionally, we neglected the thermodynamic effects of the chemical reactions on the gas and dust temperatures in order to limit the computational cost of the simulations.
2.3 Population of planetesimals
We assumed that 50% of the dust was converted into km-sized planetesimals uniformly throughout the disc by 105 yr. Once planetesimals form, they no longer participate in chemical interactions with the gas or the remaining 50% of dust in the disc. Their large size results in a very low total surface area per unit volume, making surface chemistry extremely inefficient.
The presence of planetesimals also reduces the amount of ice material that can be released into the gas phase due to thermal processing (Gkotsinas et al. 2024). Planetesimals were therefore treated as a sink for refractory material and ice, which is subtracted from the initial chemical budget and does not participate in the subsequent chemical evolution of the disc. Their ice content was determined by the composition of the ice phase of the disc at their formation location at 105 yr.
3 Chemistry in a static disc
To quantify the relative effects of the physical and chemical evolution on the distribution of volatiles in the midplane, we first simulated the chemical evolution of a stationary disc populated by grains of size 0.1 μm. We performed simulations for the two different sets of initial chemical abundances (inheritance and reset) and ionisation rates (SLRs and SLRs+CRs). The surface density and temperature of the gas and the dust were set by Eqs. (1) and (10). Figure 3 shows the resulting abundance profiles of the main molecular carriers of C, O, and N at 3 Myr.
Globally, our results for the static disc are consistent with the trends found by Eistrup et al. (2016) at 1 Myr, which we used to benchmark our implementation of chemical kinetics in JADE. The main differences arise from the disc structure and the initial gas-phase metallicity, which in our case reflects a more detailed compositional model that includes refractory and semi-refractory components.
In the inheritance-low scenario (panels a and b), chemical evolution largely preserves the initial molecular budget. Thermal desorption and freeze-out dominate, driving the phase transitions at the snowlines. The difference between the abundances of volatiles in the ice phase (solid lines) and the initial molecular abundances (horizontal dash-dotted lines) stems from our assumption that 50% of the dust is converted into chemically inert planetesimals early in the disc’s evolution and uniformly throughout the disc, effectively halving the abundances of volatiles in the remaining ice phase.
Increases in the ionisation rate favour direct ionisation reactions and photoreactions by CR-induced UV photons. In the inheritance-high scenario (panels c and d), the CH4 gas is depleted between its snowline (~40 au) and that of CO2 (~5 au) due to its CR-driven conversion into CO2. We find that this depletion persists even after 3 Myr, consistent with the results of Eistrup et al. (2018). Similarly, CRs drive the destruction of NH3 in favour of N2 between 3 and 6 au, that is, at temperatures ranging from 120 to 70 K and number densities from 5 × 10¹² to 1012 cm-3. Our results also indicate that NH3 ice becomes the primary nitrogen reservoir in the outer disc under high ionisation conditions and its abundance doubles compared to the initial value near the N2 snowline (~85 au). The inclusion of surface chemistry allows us to capture additional effects, such as CR-induced photodissociations of ice species in situ, which are responsible, for example, for the depletion of CH3 OH and CO beyond their snowlines (~2.5 au and 70 au, respectively).
For both ionisation levels, the sublimation of Cref within 5 au (see Sect. 2.2.1) favours the formation of carbon-rich radicals and chains, hydrocarbons (e.g. C2H2 and C2H6), nitriles, and promotes the conversion of small organic molecules (e.g. CH4 and CH3OH) into larger organics and complex organic molecules (e.g. CH3CHO, CH3COOH, CH3COCH3). The cumulative abundance of these species – here collectively referred to as ‘carbon-rich compounds’ (CRC) for simplicity – is represented by the black profile in Fig. 3, and reaches levels comparable to H2O within the Cref snowline (panels a and c). This chemical pathway is particularly efficient when Cref is released as atomic carbon into the gas phase. The effects of releasing Cref in other chemical forms, such as hydrocarbons (e.g. Houge et al. 2025), or at higher temperatures (e.g. Gail & Trieloff 2017; van’t Hoff et al. 2020), are not explored here and will be addressed in future work.
When considering the reset scenarios (panels e through h), chemistry is overall more active. For both ionisation levels, the main gas-phase carriers of C, O, and N are H2O, CO, O2, HCN, and N2, while CO2, CH4, and NH3 are significantly depleted. Specifically, H2 O and HCN dominate within 1 au, while CO and N2 become the primary carriers from about 1 au to their respective snowlines beyond 60 au. CO, in particular, forms readily in these scenarios from available atomic C and O, especially within the Cref snowline, where its abundance increases by a factor of 2 compared to the outer disc (panels e and g). Between 4 and 40 au, O2 rises to the same level as CO, reaching an abundance of about 8 × 10⁻⁵, while CH4 remains below 10-7. Beyond 40 au, O2 condenses as ice, but only under low ionisation conditions. In the reset-high scenario, O2 is efficiently destroyed in the outer disc due to its high reactivity to cosmic ray-induced photoreactions (see also Eistrup et al. 2016). Another difference between the low and high ionisation scenarios is in the ice-phase abundances of H2O, CO2, and NH3, which are all systematically higher in the reset-high scenario. In contrast to the inheritance scenarios, the abundance of CRC is significantly reduced throughout the disc due to the efficient and early conversion of atomic carbon into CO and the limited availability of molecular precursors for complex organic synthesis.
Overall, variations in the initial chemical conditions mainly affect the oxygen and nitrogen chemistry. Specifically, the gas phase in a disc midplane that has undergone a chemical reset is more enriched in oxygen compared to the inheritance scenario and undergoes significant depletion of NH3 in favour of other N-bearing species, such as HCN. This emphasises an intrinsic difference between the inheritance and reset chemical scenarios, which directly impacts the midplane elemental ratios (see Sect. 6).
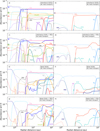 |
Fig. 3 Radial abundance profiles of the main C-, O- (left), and N-bearing (right) volatile molecules in the gas phase (dotted lines) and in the ice phase (solid lines) in the disc midplane after 3 Myr of chemical evolution without mass transport in the disc (stationary disc). The results are shown for the four chemical scenarios assuming a grain size of 0.1 μm. The horizontal small arrows indicate the initial abundances of H2O, CO, CO2, CH3OH, CH4, N2, and NH3 in the gas phase in the inheritance scenario (see also Table 2); note that CO and CO2, as well as N2 and NH3, share the same initial abundance. The black profile (CRC), represents the cumulative abundance of additional carbon-rich compounds, including carbon chains, hydrocarbons, nitriles, and other complex organics that are not among the dominant volatile carriers. |
4 Transport of gas and dust
The results for the stationary disc isolate the effects of chemical processes on the composition of the midplane, providing a basis for interpreting the chemical outcomes of our fully integrated model. Before delving into the chemistry, we first examined the effects of mass transport on the radial distribution of gas and dust in the midplane, which in turn governs the radial redistribution of volatiles in the disc.
Figure 4 compares the evolution of the surface density of gas (violet) and dust (pink) in the three grain size scenarios. The dust surface density represents the mass distribution of dust grains, excluding the contribution from ice mantles. While our model accounts for ice formation beyond snowlines, we neglected its impact on grain dynamics, and therefore did not include the mass of the ice mantles in the plotted dust surface densities.
In line with the predictions of viscous evolution, the majority of the gas in the inner disc is transported inwards and ultimately lost to the star, while a smaller fraction is moved outwards to larger radii (see the dash-dotted violet curve).
Over the first 3 Myr, the mass accretion flux, Ṁ, evolves I as shown in Fig. 5. Ṁ represents the mass flux calculated at the interface between adjacent grid points. At the disc’s inner edge, the accretion rate onto the star is approximately 1.4 × 10⁻⁹ M⊙/yr. Over the timescale of our simulations, this results in the accretion of about 9% of the initial gas mass. Specifically, the disc’s gas mass decreases from approximately 5.4 × 10⁻² M⊙ to 4.9 × 10⁻² M⊙ over 3 Myr. Notably, about 1% of the disc mass is initially located within 4 au of the star and is accreted within the first 3.5 × 10⁵ yr. As a result, the inner disc midplane is depleted in less than 1 Myr and is continuously replenished with material from the outer disc. If volatiles (gas and ice) are less abundant in the outer disc than in the inner disc – as in our model, where part of the initial ice budget is sequestered by planetesimals that chemically decouple from the gas – the mass redistribution caused by viscous accretion alters the overall elemental balance of volatiles in the inner disc. This effect, independent of chemical processes but captured by our model, is further discussed in Sect. 5.1.
The dynamical evolution of dust grains is strongly influenced by the strength of the gas-dust coupling. As long as St ≪ 1, the grains remain tightly coupled to the gas, and the radial drift acts on much longer timescales than the viscous timescale of the disc (tdrift ≫ tvisc). This scenario applies to submicrometresized grains (left panel in Fig. 4). Dragged along by the gas, these grains accrete onto the star, resulting in a 3-fold decrease in dust surface density within 100 au after 3 Myr.
As the grain size increases and the Stokes number approaches 1, the grains gradually decouple from the gas and experience a stronger inward drift. In the scenario with 20 μm grains (central panel in Fig. 4), tdrift becomes shorter than tvisc from about 50 au outwards. The dust in this region drifts inwards on a timescale of about 10 Myr, partially offsetting the initial dust mass loss within 50 au due to gas drag. After 3 Myr, all grains are located within 200 au, with most of the mass concentrated within 100 au, and the dust surface density within 50 au has returned to approximately its initial value.
For larger grains, radial drift dominates over viscous evolution and significantly influences the radial extent of the dust disc. In the scenario with 100 μm-sized grains (right panel in Fig. 4), the disc region where the dust drifts faster than the gas extends from about 5–10 au outward. Here, radial drift operates on a timescale of about 2 Myr, leaving only a small amount of dust beyond 50 au (Σd ≲ 10-6 g cm-2) by the end of the simulation. Meanwhile, the dust mass within the first 5 au increases by a factor of up to ∼3, as does the dust-to-gas mass ratio.
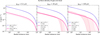 |
Fig. 4 Evolution of the surface density of the gas (violet curves) and the dust (pink curves) in the three scenarios with grains of size 0.1 μm, 20 μm, and 100 μm, assuming α = 10-3. The solid lines represent the initial conditions at t = 104 yr, while the dotted, dashed, and dash-dotted lines show the evolved profiles at 0.1, 1, and 3 Myr, respectively. The effect of the inward radial drift of the dust relative to the gas becomes stronger with increasing grain size. Note that the surface density of the dust does not include the mass contribution of the ice mantles beyond the snowlines. |
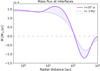 |
Fig. 5 Radial profiles of the mass accretion flux in the disc midplane in units of solar masses of gas per year. The plot shows the mass flux computed at the edges of each grid point at t = 104 yr (solid curve) and t = 3 Myr (dashed curve), corresponding to the beginning and the end of our simulations, respectively. The accretion flux is positive up to about 120 au and then becomes negative. A positive (negative) accretion flux indicates gas transport towards (away from) the star, which is consistent with the predictions of viscous evolution. |
5 Chemistry in an evolving disc
Mass transport redistributes volatiles throughout the disc, locally altering density, temperature, and ionisation rates. Its impact on disc composition depends on the competing timescales of chemical reactions and transport processes (diffusion, mixing, and radial drift), with the strongest deviations from the stationary picture expected in the inner disc, within the snowlines, and in regions of steep compositional gradients (Booth & Ilee 2019).
Figures 6 and 7 present the molecular composition of the disc at 3 Myr, as obtained from our fully integrated model across the four chemical scenarios and three grain sizes. Overall, our results reveal a fundamental interplay between chemistry and dynamics, demonstrating that these processes cannot be treated independently and must be modelled concurrently. This remains true even in regimes of strong gas–dust coupling and negligible radial drift, especially when a fraction of the dust has already been incorporated into larger bodies, such as planetesimals, thereby altering the elemental balance of the disc (see Sect. 5.1 for further discussion).
The most immediate chemical consequence of radial drift is the enrichment of the gas phase with volatiles inside the snowlines. The magnitude of this enrichment is governed by the relative timescales of viscous transport (Eq. (5)) and radial drift (Eq. (9)). When tdrift ≪ tvisc, icy grains are efficiently transported inwards and cross the snowlines, where their volatile content sublimates into the gas phase. This process creates local peaks in the gas-phase abundances of volatile species near the snowlines, which are then redistributed on a viscous timescale (Booth & Ilee 2019). Since tvisc is longer in the outer disc, these enrichment features can still be seen at 3 Myr – for example, in the gas-phase abundances of CO, CH4, and N2 in the 20μm-sized grains scenario (central column in Figs. 6 and 7).
Our findings indicate that even a population of relatively small grains (<100 μm) can drive significant volatile enrichment in the gas phase through radial drift on timescales comparable to those of planet formation (see Sect. 5.2 for details). This suggests that giant planets can accrete metal-rich gas from sublimating icy grains, even in scenarios where the bulk of pebbles (mm–cm-sized grains) has already been converted into larger bodies or accreted onto the star, leaving behind only a population of small grains in the disc.
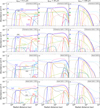 |
Fig. 6 Radial abundance profiles of the main C- and O-bearing volatile molecules in the gas phase (dotted lines) and in the ice phase (solid lines) in the disc midplane after 3 Myr of evolution with the time-dependent model (full model). The results are shown for the four chemical scenarios and the three investigated grain sizes assuming α = 10-3. The horizontal small arrows indicate the initial abundances of H2O, CO, CO2, CH3OH, and CH4 in the gas phase in the inheritance scenario (see also Table 2). Note that CO and CO2 have the same initial abundance. The black profile (CRC), represents the cumulative abundance of additional carbon-rich compounds, including carbon chains, hydrocarbons, nitriles, and other complex organics. |
5.1 Strong gas–dust coupling
The scenario with 0.1 μm-sized grains (first column in Figs. 6 and 7) represents strong gas–dust coupling, where the chemical variations due to mass transport are primarily driven by viscous transport, with a negligible influence of radial drift.
Most volatile species exhibit systematically lower abundances compared to their initial values (dash-dotted lines) and the stationary solution (Fig. 3). This decrease is inversely related to the volatility of the species. For example, in the inheritance-low scenario (panel a in Figs. 6 and 7), the depletion at 3 Myr amounts to a factor of 2 for H2O but is negligible for N2. The effect is a direct consequence of inward mass transport following the early conversion of 50% of the dust into planetesimals, which alters the elemental balance across the disc. As discussed in Sect. 3, planetesimal formation depletes the outer-disc ice phase of volatiles, trapping part of them in chemically inert large bodies. As a result, the remaining gas-ice mixture beyond the snowlines contains fewer volatiles than the gas originally present within the snowlines. As this gas moves inwards and is replenished by gas and ice (which sublimates at the snowlines) from the outer disc, the altered elemental balance is also transported inwards. The net effect is a gradual decrease in the gas-phase abundances of volatile species and in the gas metallicity within the snowlines (see also Appendix A). In the case of N2, the depletion is less pronounced because it constitutes a smaller fraction of the total ice reservoir. Consequently, a smaller amount of N-bearing volatiles is sequestered in planetesimals compared to less volatile species like H2O.
In the inheritance-low scenario, another notable difference from the stationary solution is that the gas-phase CH4 is less depleted between 2 and 5 au due to its partial replenishment by CH4 from the outer disc.
Radial diffusion and mixing tend to attenuate local inhomogeneities and smooth out abundance peaks in both the gas and ice phases. In the inheritance-high scenario (panel d), this process counteracts the CR-driven depletion of NH3 between 3 and 6 au. A similar effect is seen with H2O ice, which is less depleted between 5 and 30 au. In this region, CO gas shows a gradual depletion rather than the plateau seen in the stationary solution, and O2 decreases by nearly an order of magnitude.
In the reset scenarios (panels g and j), CO2 is strongly depleted within its snowline in the stationary solution but reaches abundances of about 10-5 (reset-low) and 4 × 10⁻⁵ (reset-high) when mass transport is taken into account. In the ice phase, the most affected species is H2O. In the full-model solution, its abundance remains uniform from 2 au onwards and systematically above 10-5. In contrast, in the stationary solution, it drops below 10-7 within 5 au and decreases significantly between 5 and 20 au (Sect. 3).
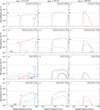 |
Fig. 7 Radial abundance profiles of the main N-bearing volatile molecules in the gas phase (dotted lines) and in the ice phase (solid lines) in the disc midplane after 3 Myr of evolution with the time-dependent model (full model). The results are shown for the four chemical scenarios and the three investigated grain sizes assuming α = 10-3. The horizontal small arrows indicate the initial abundance of N2 and NH3 in the gas phase in the inheritance scenario (see also Table 2). |
5.2 Weak gas–dust coupling
The centre and right columns of Figs. 6 and 7 show the results for grains of size 20 μm and 100 μm, respectively, representing scenarios with non-negligible radial drift.
The abundance profiles of the ice-phase species (solid lines) closely follow the evolution of the dust surface density (Fig. 4). With 100 μm-sized grains, radial drift shrinks the dust disc to 50 au over a timescale of 2 Myr (Sect. 4), leading to the complete depletion of all ice species that condense beyond the CH4 snowline.
In the gas phase (dotted lines), volatile molecules released by drifting grains in the outer disc tend to remain concentrated just inside their respective snowlines. This effect is particularly pronounced for 20 μm-sized grains at the N2 snowline across all chemical scenarios (central column of Fig. 7), as well as at the CH4 and CO snowlines in the inheritance-low scenario and at the O2 and CO snowlines in the reset-low scenario (panels b and h of Fig. 6). This behaviour results from the mass flux in the disc, which approaches the inversion point near 100 au, shifting from positive to negative values and consequently slowing gas transport (Fig. 5).
Closer to the star, where the mass flux is higher, the sublimated molecules diffuse inwards on shorter timescales. This leads to a noticeable and uniform increase in the gas-phase abundances in the inner disc (within the H2O snowline), compared to the scenario with 0.1 μm-sized grains. The enrichment is more pronounced for volatile molecules that condense between 2 and 10 au, compared to those condensing further out. This is because a larger fraction of their mass exists in ice form and reaches the inner disc sooner than molecules condensing at greater distances. Over a 3 Myr timescale, we find that the abundances of H2O, CH3 OH, and NH3 are the most impacted, increasing nearly twofold in the 20 μm grain-size scenario and by almost an order of magnitude in the 100 μm grain-size scenario, relative to the 0.1 μm case. In contrast, high-volatility species like CO and N2 experience only a modest enrichment in the inner disc compared to their initial abundances.
6 Elemental ratios in an evolving disc
Figures 8, 10, and 11 compare the evolution of the C/O, C/N, and N/O ratios extracted from the molecular abundance profiles returned by JADE in the inheritance and reset scenarios with low ionisation (results for the high ionisation case are presented in Appendix B). The elemental abundances account for all molecular carriers of C, O, and N with abundances exceeding 10-7 relative to the total H nuclei. The elemental ratios in the solid phase include contributions from rocks, ice mantles, and refractory organic carbon. To generalise our results to Sun-like host stars with varying compositions, we normalised the elemental ratios to their respective stellar value and examined their radial and temporal variations as deviations from the stellar reference (e.g. Turrini et al. 2021; Pacetti et al. 2022). Normalised ratios are denoted with the superscript *.
In the scenario with 0.1 μm-sized grains, the long radial drift timescale relative to the viscous timescale minimises the impact of ice sublimation on the elemental ratios. For 20 μm-sized grains, radial drift operates on a timescale of about 10 Myr, yet the resulting enrichment in the gas phase can already be noticed from 2 Myr for some elemental ratios. In the 100 μm scenario, radial drift depletes the outer disc within approximately 2 Myr, after which its impact on the elemental ratios reaches a maximum.
6.1 C/O ratio
The combined effects of chemical processes and mass transport in the disc produce local deviations in the C/O ratio (Fig. 8) from the stellar value. These deviations increase with grain size and become significant even for sub-millimetre-sized grains. The inheritance-low case with 0.1 μm-sized grains (top-left plot in panel a) is the least affected by disc evolution, with deviations from the stellar value remaining within 20%, except between 1.5 and 3 au, where they reach peaks of 50%.
In this scenario, our model does not reproduce the classical monotonic trend in the gas-phase C/O ratio proposed by Öberg et al. (2011). The inclusion of rocks, refractory organic carbon, and a broader range of C- and O-bearing volatile molecules results in a more complex radial structure for the C/O ratio (Turrini 2023), which is then further shaped by disc evolution.
The two different sets of initial chemical conditions leave distinct signatures. In the inheritance scenario (panel a), the gasphase C/O* ratio is always superstellar, reaching peak values up to five times the stellar ratio in discs with 20 μm-sized grains and up to eight times the stellar ratio in discs with 100 μm-sized grains. Assuming a solar composition and thus a C/O ratio of 0.59 (Asplund et al. 2021), these values correspond to C/O ratios of up to 2.95 and 4.72, respectively. In contrast, the gas-phase C/O* ratio in the reset scenario (panel b) is substellar across a wide region of the disc, extending from the CO2 to the O2 snowlines (~6-50 au). This substellar trend is due to O2 entering the gas phase and enriching it with oxygen relative to carbon (see Sect. 3). This behaviour of the C/O* ratio highlights a key difference between planet-forming environments that have inherited their composition from the prestellar phase and those that have undergone a chemical reset, extending the result found by Eistrup et al. (2016) for static discs.
Temporal changes in the solid-phase C/O* ratio (bottom row in panels a and b) are mainly driven by the radial drift of dust grains. These changes are minimal for submicrometre grains but become substantial for larger grains. The accumulation of carbon-rich grains near the CO2 and Cref snowlines increases the solid-phase C/O* ratio to twice the stellar value after 1 Myr in the disc with 100 μm-sized grains. On the solar scale, this would correspond to a C/O ratio of approximately 1.2, reached within a relatively narrow region where the effects of radial drift are most pronounced.
In the gas phase (top row in panels a and b), the C/O* ratio exhibits more substantial variations over time. In most grainsize scenarios, we can distinguish two regimes: before and after radial drift becomes efficient. In the first regime (t ≲ 0.5 Myr), the evolution of the C/O* ratio is concentrated in the inner disc, within the Cref snowline. As discussed in Sect. 5.1, one of the mechanisms driving chemical evolution in the inner disc is the inward diffusion of gas depleted in volatiles after the formation of planetesimals (Sect. 5.1). The impact of this process on the gas-phase C/O* ratio depends on the relative amounts of C and O sequestered into planetesimals beyond the snowlines. In the inheritance scenario (top row in panel a), the C and O depletions nearly offset each other within the H2O snowline, limiting the temporal variations of the C/O* ratio to less than 10% (the region between the H2O and Cref snowlines is discussed in detail later). In contrast, in the reset scenario (top row in panel b), the high abundance of molecular oxygen in the gas phase in the disc region where most volatiles condense as ice results in a smaller fraction of oxygen being incorporated into planetesimals. Consequently, inward diffusion causes the inner-disc gas to become more depleted in carbon than oxygen, leading to a declining C/O* ratio within the Cref snowline. This effect is particularly pronounced in discs with 0.1 and 20 μm-sized grains, where the C/O* ratio decreases by up to 20%.
From about 1 Myr, the evolution of the gas-phase C/O* ratio is primarily driven by the sublimation of drifting icy grains and becomes most evident near the snowlines. In both chemical scenarios, local peaks in the C/O* ratio are especially pronounced in the disc with 100 μm-sized grains, particularly within the Cref snowline, where the C/O* ratio can reach up to five times the stellar value. Ice sublimation is also responsible for the increased C/O* ratio within the CH4 snowline in the inheritance scenario and the decreased C/O* ratio within the O2 snowline in the reset scenario. Our results also reveal a narrow region between 7 and 10 au, just beyond the CO2 snowline, where the gas-phase C/O* ratio reaches values up to eight times the stellar value. This elevated C/O* ratio is driven by an enhanced formation of carbon chains and hydrocarbons (e.g. C2 and H2CCC) in the gas phase between 1 and 3 Myr, peaking at 1.8 Myr. In the inheritance scenario, this process results in a total carbon abundance 4.5 times higher than that of oxygen.
In the inheritance scenario, we identify a chemically distinct region between the H2O and Cref snowlines. Here, the gas-phase C/O* ratio decreases in the first 0.5 Myr across all grain size scenarios, with steeper variations corresponding to larger grain sizes, and then increases again thereafter. The decreasing C/O* ratio results from the freeze-out of the chemical products of Cref reprocessing within its snowline. This mechanism is illustrated in Fig. 9 for the disc with 20 μm-sized grains. The plot shows the evolution of the carbon abundance at 3 au. The solid curves represent all carbon carriers that reach abundances greater than 10-7 during the disc’s evolution, while the dashed curves highlight the contributions of CRC. In the inheritance scenarios, these compounds are efficiently produced in the gas phase from the atomic carbon released within the Cref snowline (see Sect. 3). During the first 0.5 Myr, a fraction of these species condenses as ice, leading to a decrease in gas-phase carbon and a corresponding increase in ice-phase carbon, which results in a lower gas-phase C/O* ratio. The total carbon abundance (grey dash-dotted curve) decreases as gas diffuses inwards and is replaced by material that is depleted in carbon after the formation of planetesimals. After 1 Myr, radial drift becomes efficient, causing the carbon abundance and the C/O* ratio to increase again.
Similar global differences between the inheritance and reset scenarios are observed under high ionisation (see Fig. B.1), although radial drift combined with more active chemistry leads to a more moderate increase in the gas-phase C/O ratio within 10 au, with values reaching up to three times the stellar C/O ratio in the disc with 100 μm-sized grains.
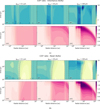 |
Fig. 8 C/O ratio in the disc as a function of distance and time for the inheritance (panel a) and reset (panel b) scenarios with low ionisation. In each panel, the top row represents the gas phase, while the bottom row shows the solid phase (including rocks, ice mantles, and refractory organic carbon). All values are normalised to the stellar C/O ratio (∼0.59), with normalisation indicated by the superscript∗. The dark contour represent a value of 1, corresponding to the stellar ratio. Vertical lines indicate the approximate locations of key snowlines at 2 Myr. Molecules are labelled only in the top-left plot of each panel but follow the same order in the other plots. |
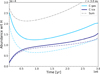 |
Fig. 9 Evolution of carbon abundance at 3 au in the inheritance-low scenario, assuming dust grains with a radius of 20 μm. The solid lines represent the total carbon in the gas (light blue) and ice (dark blue) phases, while the dashed lines isolate the contribution of CRC. The grey dash-dotted line indicates the combined total of all contributions. |
6.2 C/N ratio
The C/N* ratio (Fig. 10) appears to be a weaker diagnostic of the disc’s initial chemical conditions (inheritance vs reset) and ionisation level (high vs low) than the C/O* ratio. However, it exhibits steeper and more radially extended temporal variations in the inner disc, inward of the CO2 snowline, particularly in the 100 μm grain size scenario, making it a more effective tracer of ice sublimation driven by radial drift.
The distinct behaviour of the C/N* ratio originates from the higher volatility of nitrogen compared to carbon and oxygen. In both the inheritance and reset scenarios, approximately 60% of the initial volatile nitrogen reacts to form N2 early in the disc’s evolution, with its abundance remaining relatively stable throughout most of the disc. Variations in N2 abundance are primarily driven by the sublimation of ices drifting from beyond the N2 snowline, though this effect is largely confined to the outer disc, where the N2 snowline lies (see Fig. 7). The significant retention of nitrogen in the gas phase results in the gas-phase C/N* ratio (top row in panels a and b) exhibiting less pronounced variations than the C/O* ratio, ranging from substellar values to three times the stellar value over the course of disc evolution. In contrast, the C/N* ratio in the solid phase (bottom row in panels a and b) exhibits a much wider dynamic range across the snowlines, due to the limited nitrogen content in the ice phase.
In the gas phase, the C/N* ratio shows limited sensitivity to the initial chemical conditions. In both the inheritance and reset scenarios, two main compositional regions can be identified, separated by the CO2 snowline: beyond the snowline, where the C/N* ratio is substellar, and within the snowline, where it becomes predominantly superstellar.
Focussing on the inner region, the same considerations for the C/O* ratio apply: the early-stage evolution of the gas-phase C/N* ratio is dominated by the inward diffusion of volatile-depleted gas, while radial drift becomes important after approximately 1 Myr. However, unlike the C/O* ratio, the C/N* ratio traces the effects of ice sublimation even within the H2O snowline. In the case of strong radial drift (e.g. 100 μm grain size scenario), the C/N* ratio in this region reaches peak values up to three times the stellar value (see below for more details). In contrast, for the C/O* ratio, the enrichment is mostly confined between the H2O and the Cref snowlines. This different behaviour arises from the higher volatility of nitrogen relative to carbon, which makes the C/N* ratio more sensitive to variations in carbon abundance compared to the C/O* ratio.
For large grains in the inheritance scenario (top-right plot in panel a), the late-stage enrichment of the C/N* ratio is attenuated by the release of NH3 at its snowline. Ice sublimation within 6 au causes the gas-phase NH3 abundance to exceed that of N2, peaking at 1.4 × 10⁻⁴ around 2 Myr and gradually declining thereafter (top-right plot in Fig. 7). This release of NH3 reduces the gas-phase C/N* ratio, producing a distinct dip between the Cref and CO2 snowlines at approximately 2 Myr. As carbon continues to sublimate within the Cref and CH3OH snowlines, the C/N* ratio rises again, eventually reaching values up to twice the stellar value. In the reset scenario (top-right plot in panel b), on the other hand, N2 remains about an order of magnitude more abundant than other nitrogen-bearing species, resulting in a consistently higher C/N* ratio within the CO2 snowline, with up to a threefold enrichment at later stages. Compared to the inheritance scenario, the region inward of the CO2 snowline appears more uniformly enriched, with the main exception occurring around 3 au. At this radius, the C/N* ratio evolves more slowly due to the efficient production of cyanoacetylene (HC3N) and methylenimine (CH2NH) in the gas phase. The abundance of these two molecules starts to increase after about 0.5 Myr and reaches its peak between 1.9 and 2.4 Myr, with HC3N approaching N2 levels and CH2NH reaching 1.4 × 10⁻⁵. Our results suggest these molecules might act as significant nitrogen carriers in carbon-rich environments, though further investigation is required to confirm this possibility. Similar enrichments of C- and N-bearing organics in carbon-rich gas have also been reported in other recent models (e.g. Wei et al. 2019; Le Gal et al. 2019), suggesting that this chemical behaviour might be a general feature of carbon-rich disc environments.
The global trends discussed above are preserved under high ionisation (see Fig. B.2), although we find systematically lower gas-phase C/N ratios beyond 30 au in both inheritance and reset scenarios, driven by enhanced CO depletion (see also Sect. 6.4).
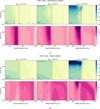 |
Fig. 10 C/N ratio in the disc as a function of distance and time for the inheritance (panel a) and reset (panel b) scenarios with low ionisation. In each panel, the top row represents the gas phase, while the bottom row shows the solid phase (including rocks, ice mantles, and refractory organic carbon). All values are normalised to the stellar C/N ratio (∼4.27), with normalisation indicated by the superscript ∗. The dark contour represents a value of 1, corresponding to the stellar ratio. Vertical lines indicate the approximate locations of key snowlines at 2 Myr. Molecules are labelled only in the top-left plot of each panel but follow the same order in the other plots. For clarity, the NH3 snowline in either scenario is not shown, however, we note that it lies within the shaded region between the Cref and CO2 snowlines. |
6.3 N/O ratio
The N/O* ratio (Fig. 11) is sensitive to both the initial chemical conditions and mass transport effects in the disc, but its diagnostic power varies across different regions. Significant differences between the inheritance and reset scenarios only arise beyond the H2O snowline. Conversely, the influence of mass transport is most pronounced within the CO2 snowline, where the radial drift leaves a clear imprint in the gas phase after about 1 Myr for grain sizes around 100 μm.
Since nitrogen is predominantly present in the gas phase as N2, while about 50% of oxygen is initially locked in rocks, the solid-phase N/O* ratio (bottom row in both panels) remains strongly substellar throughout most of the disc. The N/O* ratio approaches the stellar value only beyond the N2 snowline or in regions strongly enriched in nitrogen ice, such as near the NH3 snowline under strong radial drift conditions (e.g. 100 μm grain size scenario) in the inheritance scenario. In contrast, the gasphase N/O* ratio (top row in both panels) exhibits a much wider dynamic range, with values ranging from substellar to strongly superstellar values.
In the inheritance scenario (top row in panel a), the gas-phase N/O* ratio evolves radially in response to the condensation of O-bearing molecules and NH3. Moving outwards from the star, the ratio increases from about stellar values within the H2O snowline to about ten times the stellar value beyond the CO2 snowline. Beyond the CO and N2 snowlines, the N/O* ratio rises even further, driven by the strong depletion of O- and N-bearing species in the gas phase of the cold outer disc.
In the reset scenario (top row in panel b), the N/O* ratio exhibits more limited radial variation, remaining below twice the stellar value throughout most of the disc. This is because oxygen is predominantly carried by CO and O2, which maintain similar abundances in the gas phase and condense only in the cold outer disc. In this scenario, the depletion of NH3 and other minor N-bearing species further reduces the influence of snowlines on the N/O* ratio.
Temporal variations in the gas-phase N/O* ratio are most pronounced inside the CO2 snowline and in the outer disc. Under strong radial drift (e.g. 100 μm grain size scenario), the sublimation of oxygen-rich icy grains causes the gas-phase N/O* ratio to rapidly drop to substellar values after approximately 1 Myr in both chemical scenarios. In the inheritance scenario, this trend is partially offset by the sublimation of NH3-rich grains, keeping the ratio superstellar between the H2 O and NH3 snowlines. Additional variations occur in the outer disc near the O2 and N2 snowlines, where radial drift overtakes viscous transport on a timescale of less than 1 Myr.
At high ionisation (see Fig. B.3), similar global trends are recovered, though the gas-phase N/O ratio exhibits more pronounced temporal variations beyond 10 au, primarily due to enhanced CO depletion.
6.4 Multi-element analysis of disc composition
In this section, we present a pairwise comparison of elemental ratios and show how a multi-element approach helps to identify signatures of disc evolution across different regions of the disc.
Figure 12 compares pairs of normalised elemental ratios in four key compositional regions, delimited by the snowlines of H2 O, CO2, and CH4. Each panel shows the evolution of the ratios over 3 Myr for all simulated scenarios. The values represent the gas-phase elemental ratios at different time steps calculated from the total abundances of C, O, and N averaged over the radial extent of each region and weighted by the surface density profile of the gas.
Distinct chemical scenarios generally do not leave clear signatures within the H2O snowline (region 1, top-left), where all ices are sublimated, especially at early stages (<1 Myr). The evolutionary paths of the N/O* and C/O* ratios often overlap, ranging from substellar to superstellar N/O* ratios and from stellar to superstellar C/O* ratios. However, while superstellar C/O* and N/O* ratios remain highly degenerate, C/O* ratios near stellar values are more typical of later stages (>1 Myr) in reset scenarios with negligible radial drift (e.g. 0.1 μm-sized grains). In contrast, substellar N/O* ratios emerge only in scenarios with efficient radial drift (e.g. 100 μm-sized grains after 1 Myr), where a larger fraction of oxygen is released into the gas phase compared to nitrogen.
The dynamic range of N/O* and C/O* variations broadens between the H2O and CO2 snowlines (region 2, top-right). In this region, the comparison reveals a clearer separation between the results associated with the two chemical scenarios. Scenarios with negligible or moderate radial drift (e.g. 0.1-20 μm-sized grains) typically lead to higher ratios - C/O > 1.5 and N/O > 4 -under chemical inheritance, but yield lower values in the reset case, namely C/O < 1.5 and N/O ratios ranging from stellar to 4× stellar. The different trend is again a consequence of the greater fraction of oxygen that remains in the gas phase as O2 after a chemical reset. Regions with a relatively high C/O* ratio (>1.5) and a relatively low N/O* ratio (>4) are instead only populated by evolutionary scenarios with efficient radial drift (e.g. 100 μm-sized grains after 1 Myr).
Between the CO2 and CH4 snowlines (region 3, bottom left), the separation between the inheritance and reset scenarios becomes even clearer. In the reset scenarios, the evolutionary tracks remain limited to substellar C/O* ratios, with slightly superstellar values only reached in the scenario with 100 μm-sized grains after 1 Myr. In the inheritance scenarios, the C/O* ratio is always superstellar and ranges from about 1.3 to 2 for high ionisation levels and from 2 to 2.5 for low ionisation levels. The N/O* ratio spans a much larger dynamic range globally than in region 2, ranging from substellar to strongly superstellar (>10) values, and is always lower in the reset scenarios than in the inheritance scenarios.
The steep increase in the N/O* ratio in region 3, especially at later stages in the inheritance-high scenario, results from oxygen reaching a much lower abundance than nitrogen in the cold outer disc due to chemical processing and the relative positions of the snowlines of their main volatile carriers (see Figs. 6 and 7). At larger distances, this effect becomes even more pronounced, leading to higher N/O* ratios. Beyond the CH4 snowline (region 4, bottom-right), the C/N* ratio provides a more robust diagnostic. In this region, comparing C/N* with C/O* helps resolve degeneracies in the chemical scenario and ionisation level that would otherwise arise from relying on a single elemental ratio. For example, although the C/N* ratio remains substellar across all scenarios, it exceeds 0.15 only in weakly ionised environments and remains below 0.10 under high ionisation. The C/O* ratio then allows us to distinguish between the inheritance scenario (C/O ≳ 1.7) and the reset scenario (C/O ≲ 1.7).
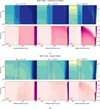 |
Fig. 11 N/O ratio in the disc as a function of distance and time for the inheritance (panel a) and reset (panel b) scenarios with low ionisation. In each panel, the top row represents the gas phase, while the bottom row shows the solid phase (including rocks, ice mantles, and refractory organic carbon). All values are normalised to the stellar N/O ratio (∼0.14), with normalisation indicated by the superscript ∗. The dark contour represents a value of 1, corresponding to the stellar ratio. Vertical lines indicate the approximate locations of key snowlines at 2 Myr. Molecules are labelled only in the top-left plot of each panel but follow the same order in the other plots. For clarity, the NH3 snowline in the reset scenario is not shown but lies within the shaded region between the HCN and CO2 snowlines. |
7 Discussion and comparison with previous works
A key difference between our study and earlier models of coupled chemical and dynamical evolution in protoplane-tary discs (e.g. Eistrup et al. 2018; Cridland et al. 2017; Booth & Ilee 2019; Cevallos Soto et al. 2022; Mah et al. 2023) lies in the treatment of the initial chemical conditions of volatiles (i.e. gas and ices). Earlier works typically assumed a uniform, subsolar volatile C/O ratio throughout the disc, consistent with the elemental composition of ices in dark clouds (e.g. Marboeuf et al. 2014; Mumma & Charnley 2011). Our compositional model additionally accounts for the fraction of oxygen sequestered in phyllosilicates and other O-bearing minerals, based on mete-oritic constraints, as well as the presence of semi-refractory organic carbon, which contains a significant fraction of the total carbon budget and progressively sublimates in the inner disc (see Sect. 2.2.1). The resulting elemental ratios for the volatile component (gas + ice mantles) as a function of radius and time are presented in Appendix C. The disc was initialised with a radial gradient in the volatile C/O ratio: subsolar (~0.35) in the outer disc, where Cref remains in the refractory phase, increasing interior to 5 au, and reaching supersolar values (~1.07) inside 1 au, where all Cref is in the gas. As a consequence, the disc chemistry evolved under a range of C/O regimes, including C-rich environments that promote the formation of hydrocarbons and oxygen-poor organics (see Sects. 3 and 6.1). Observational evidence for such C-rich chemistry has recently emerged from JWST observations of discs around low-mass stars (e.g. Tabone et al. 2023; van Dishoeck et al. 2023; Colmenares et al. 2024). Although this study focuses on a solar-mass star, our model provides a general theoretical framework for interpreting the origin of C-rich environments, particularly in scenarios involving radial drift and the erosion of refractory organic carbon in the inner disc. However, a direct comparison with observations will require extending the model to include the vertical disc structure and implementing full radiative transfer calculations.
A second key difference in our model is the inclusion of planetesimal formation, which is typically neglected in coupled chemical-dynamical models. By permanently removing volatiles from the cycling material, planetesimal formation alters the chemical regimes under which gas and dust evolve and affects the distribution of elemental ratios across the disc (see Sect. 5.1).
A consequence of the above considerations is that our simulations yield gas-phase C/O ratios that remain supersolar at all times within the Cref snowline, across all analysed scenarios. In contrast, previous studies typically find subsolar C/O ratios in the inner disc, driven by the efficient release of oxygen from waterice sublimation. For example, Cevallos Soto et al. (2022), who adopted the same chemical network as this work and modelled monodisperse dust populations, report C/O < 1 within 10 au across both inheritance and reset scenarios. Comparable results are found by Booth & Ilee (2019) for the inheritance case. Mah et al. (2023), who included a refractory carbon erosion front at T > 631 K, obtain supersolar C/O between the water and carbon snowlines only after 3 Myr in discs around solar-mass stars with α = 10-3.
This comparison highlights the sensitivity of coupled chemical-dynamical evolution to key model assumptions, including the adopted stellar abundances, the initial partitioning of elements into volatile, refractory, and semi-refractory phases, and the relative volatility of each component. In particular, the chemical nature and sublimation properties of semi-refractory species such as Cref, which play a key role in shaping the disc’s elemental budget, warrant further investigation to better constrain their influence on the chemical environments of planet-forming regions.
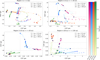 |
Fig. 12 Evolutionary tracks of the elemental ratios over 3 Myr across all considered scenarios. Ratios are shown in pairs across four key compositional regions: within the H2O snowline (region 1, top-left), between the H2O and CO2 snowlines (region 2, top-right), between the CO2 and CH4 snowlines (region 3, bottom-left), and beyond the CH4 snowline (region 4, bottom-right). Values represent gas-phase elemental ratios, calculated from total elemental abundances averaged over the radial extent of each region and weighted by the surface density of the gas. The colour bars indicate the four chemical scenarios, with time progressing from lighter to darker shades. The three different markers represent the selected grain sizes and are placed along each track every 200 000 yr. The dark marker on each track denotes 1 Myr. Dashed grey lines highlight regions of the parameter space where pairwise comparisons of the elemental ratios provide constraints on specific scenarios or subsets of scenarios. |
8 Caveats of the model assumptions
This study aims to investigate how key processes and initial conditions impact the chemical composition of protoplanetary discs in the regions where planet formation takes place. While our model accounts for the complex interplay between chemical evolution and mass transport, it is not intended to capture every aspect of disc physics and chemistry.
We treated the disc as an infinitely thin structure that evolves in isolation from its surrounding environment, neglecting effects such as late accretion of material onto the disc (e.g. Gupta et al. 2023), external feedback from nearby stars (e.g. Keyte & Haworth 2025), and mass loss via disc winds (e.g. Lesur 2021). These processes can influence the disc’s density and temperature structure, with potential chemical implications, and should be included in more comprehensive models of disc evolution.
In addition, our model assumes that the midplane is chemically isolated from the upper layers of the disc. Vertical mixing and large-scale meridional flows can redistribute material processed in the warm, UV- and X-ray-irradiated surface regions down to the midplane, potentially introducing additional chemical pathways not captured here (e.g. Semenov & Wiebe 2011; Furuya & Aikawa 2014). The inclusion of such effects would require a coupling of the vertical disc structure with radiative transfer and dynamical mixing, which is beyond the scope of this work.
At the beginning of our simulations, we assumed that all the dust settled in the midplane, with an initial dust-to-gas mass ratio of 0.01. We also assumed that the formation of planetesimals occurred early (t ∼ 105 yr) and with uniform efficiency throughout the dust disc, converting 50% of the initial dust into large bodies that are chemically decoupled from the gas and the remaining submillimetre grains.
Evidence from the Solar System supports the assumption that the radial extent of the planetesimal disc matches that of the dust disc (Kretke et al. 2012). However, the primary mechanisms governing planetesimal formation and their radial efficiency remain uncertain (see Dra˛z˙ kowska et al. 2023 for a recent review). The depletion of volatiles in the inner disc due to mass transport following planetesimal formation (Sect. 5.1) could be more pronounced if a larger fraction of the initial dust were converted into planetesimals or less pronounced if planetesimal formation were less efficient in the outer disc (e.g. beyond the CO2 snowline).
The timing of planetesimal formation also remains an open question. Planetesimals must form early enough for giant planets to grow before the gas in the disc disperses, typically within ∼5– 10 Myr. The process can begin as early as the Class 0/I stage. For example, Bonsor et al. (2023) characterised planetary material recently accreted by white dwarfs, whose spectra suggest the accretion of iron-core or mantle-rich material, which can only form in the presence of strong heating, most plausibly from the decay of SLRs with half-lives less than 1 Myr. This points to planetesimal formation occurring as early as ∼105 years after cloud collapse (see also Cridland et al. 2022; Hühn et al. 2025). Protoplanetary discs might therefore enter the Class II stage with a significant fraction of their dust already converted into planetesimals. This hypothesis is further supported by models suggesting a significant dust drift prior to disc formation, potentially leading to a dust-enriched disc at early times (Lebreuilly et al. 2020). Observationally, dust masses in Class II discs are often significantly lower than those inferred for embedded Class 0/I systems (e.g. Tychoniec et al. 2020). This is consistent with the idea that a considerable amount of dust might already have been incorporated into larger bodies by the time discs reach the Class II stage. If the process of planetesimal formation introduces radial inhomogeneities in the volatile content of the remaining dust, then our results suggest that it should be modelled alongside chemical processes.
For the residual dust grains, each simulation assumes a single size in the sub-millimetre regime, neglecting the effects of dust coagulation and fragmentation. We recognise that, in a more realistic model, these processes lead to a continuous size distribution in which large grains (near the fragmentation barrier) dominate the mass, while small grains (resulting from fragmentation) dominate the surface area available for chemistry (e.g. Birnstiel 2024). Allowing grains to grow beyond 100 μm would reduce the efficiency of surface chemistry, leading to slower variations in ice-phase abundances due to chemical reactions (Eistrup et al. 2022; Navarro-Almaida et al. 2024). At the same time, larger grains drift faster, so the general trend of sublimation-driven enrichment of the gas phase would likely be preserved or even enhanced. In addition, if grain growth significantly reduces the mass fraction of the smallest grains, our results might overestimate their chemical contribution. Alternatively, our small-grain results might be representative of discs where abundant small grains persist due to the presence of second-generation dust produced by collisions of larger bodies (Turrini et al. 2019; Guidi et al. 2022). Future work incorporating a full grain-size distribution and exploring different scenarios for planetesimal formation will be required to resolve these degeneracies and quantify the effects more precisely.
9 Summary and conclusions
In this study, we investigate how chemical processes and mass transport in the midplane of a Class II protoplanetary disc shape the composition of the gas and dust from which planets form. Specifically, we examined the combined effects of volatile chemical processing, the viscous evolution of the gas, and the radial drift of the dust, taking into account both gas-phase and surface chemistry as well as viscous heating and turbulent mixing.
While most studies focus on discs that retain their initial molecular inventory, here we also investigate the impact of alternative scenarios for the volatile chemistry. Specifically, in addition to the full-inheritance scenario, we also studied the case of a complete reset of the chemistry and analysed both scenarios under two ionisation environments: one dominated by the decay of short-lived radionuclides and another with an additional contribution from cosmic rays. We derived the initial budget of volatiles in the disc in the context of a more realistic and observationally constrained compositional model that accounts for the presence of refractory and semi-refractory components, including refractory organic carbon. In addition, we analysed three different scenarios for the size of the dust grains. We focussed on submillimetre grains (0.1, 20, and 100 μm), namely, grain sizes that are significantly smaller than those typically assumed for pebbles in discs (i.e. mm-cm range). We quantified the impact of processes such as ice sublimation due to such a population of relatively small grains.
We simulated the evolution of the disc over 3 Myr using our fully integrated 1D code JADE, assuming a viscous α parameter of 10-3. The analysis of the resulting time-dependent molecular abundance profiles and elemental ratios (C/O, C/N, and N/O) in the disc reveals that:
The chemistry and dynamics in discs are tightly interconnected and must be modelled simultaneously. This applies even in discs where dust remains strongly coupled to the gas (grain size <0.1 μm) and radial drift is negligible. Radial diffusion and mixing, in particular, tend to smooth out local peaks in the abundances of volatile species, which often emerge in chemically active environments (e.g. after a chemical reset or under high ionisation conditions);
Radial drift can drive significant volatile enrichment in the gas phase, even for relatively small grains (≲100 μm), on timescales comparable to those of planet formation. Within their snowlines, species such as H2O, CO2, and NH3 can reach enrichment factors of nearly twofold for 20 μm-sized grains and almost an order of magnitude for 100 μm-sized grains compared to the 0.1 μm case over 3 Myr. In contrast, highly volatile species such as CO and N2 experience only modest enrichment. These results suggest that giant planets can accrete metal-rich gas from sublimated icy grains, even when the bulk of pebbles (mm–cm-sized dust grains) have already been converted into larger bodies or accreted onto the star, leaving only smaller grains in the disc;
The formation of planetesimals in a viscously evolving disc can indirectly alter the volatile budget and metallicity of the gas phase within the snowlines. This effect results from the combined processes of inward mass transport and ice sublimation. Planetesimals sequester part of the initial ice budget in a chemically inert reservoir, effectively reducing the total amount of volatiles carried by dust grains. As the disc evolves, the gas within the snowlines is replaced by gas from the outer disc, which is enriched by the sublimation of the volatile-depleted grains. If planetesimals form early and with constant efficiency throughout the disc, this process leads to a net depletion of volatiles in the inner-disc gas phase on short timescales (≲0.5 Myr). This depletion exhibits a strong volatility-dependent trend: species with a lower volatility, such as H2O or CO2, are more depleted than highly volatile species such as N2. This, in turn, also alters the gas-phase elemental ratios. These results underline the importance of accounting for planetesimal formation in models that are aimed at linking disc chemistry to planetary compositions;
Disc evolution leads to strong local enhancements in the C/O* ratio, up to 8× stellar in the gas phase (C/O ~4.72 on the solar scale) and 2× stellar in the solid phase (C/O ~1.2 on the solar scale) in models with significant radial drift (e.g. 100 μm-sized grains). Even in the less perturbed scenario -inheritance with the ionisation from SLRs and 0.1 μm-sized grains – temporal variations range within 20% of the stellar value, with peaks of 50% between 1.5 and 3 au. Notably, none of the analysed scenarios were able to reproduce the classical monotonic trend of the gas-phase C/O ratio with radial distance (Öberg et al. 2011), which is widely assumed in planet formation studies;
The erosion of refractory organic carbon can significantly influence the composition of the gas in the inner disc. If released as atomic carbon between the H2O and CO2 snowlines, it reacts to form carbon chains and organic compounds that subsequently condense over a timescale of about 0.5 Myr. This process typically leads to a net decrease in gas-phase carbon abundance. However, in the case of strong radial drift, carbon is enriched in the gas phase more efficiently than it is reprocessed, resulting in a net increase. This mechanism also affects the elemental ratios, driving local enhancements of up to 4.5× stellar in the C/O* ratio and 3.7× stellar in the C/N* ratio. These results highlight the potentially critical role of refractory organic carbon on the chemical composition of planetary building blocks, emphasising the need to account for this additional carbon reservoir in planet formation models. In this respect, efforts aimed at characterising the mechanisms behind carbon erosion in the inner region of protoplanetary discs are highly valued. Thus, further investigations are strongly encouraged;
While individual elemental ratios provide valuable insights into disc evolution, comparing multiple ratios is key to isolating signatures of specific scenarios. For example, a pairwise comparison of the C/O* and N/O* ratios between the H2O and CH4 snowlines reveals distinctions between the inheritance and reset scenarios that would be less evident when considering either ratio alone. Beyond the CH4 snowline, comparing the C/O* and C/N* ratios further constrains the ionisation level.
Our results demonstrate that chemical processes, combined with gas and dust transport, significantly alter the composition of protoplanetary discs over timescales exceeding 2 Myr and comparable to those of planet formation. Disc evolution cannot be neglected, even in systems that have retained their original molecular inventory or where dust grains experience minimal radial drift. Consequently, the growth and migration of planetary bodies must be modelled alongside the chemical and dynamical evolution of their surrounding environment. In a forthcoming companion paper, we will investigate how this evolving disc composition influences the chemical makeup of giant planet atmospheres.
Acknowledgements
This work was carried out within the framework of, and with the support of, the European Research Council via the Horizon 2020 Framework Programme ERC Synergy “ECOGAL” Project GA-855130. E.P. and D.T. acknowledge support from the Italian Space Agency (ASI) through the ASI-INAF grant No. 2016-23-H.0 plus addendum No. 2016-23-H.2-2021, and the ASI-INAF contract No. 2021-5-HH.0. C.W. acknowledges financial support from the Science and Technology Facilities Council and UK Research and Innovation (grant numbers ST/X001016/1 and MR/T040726/1). The computational resources for this work were supplied by the Genesis cluster at INAF-IAPS and the technical support of Scigé John Liu is gratefully acknowledged. Finally, we thank the anonymous referee for their constructive comments and suggestions, which helped improve the clarity and quality of this manuscript.
References
- Allègre, C., Manhès, G., & Lewin, É. 2001, Earth Planet. Sci. Lett., 185, 49 [CrossRef] [Google Scholar]
- Altwegg, K., Balsiger, H., Hänni, N., et al. 2020, Nat. Astron., 4, 533 [NASA ADS] [CrossRef] [Google Scholar]
- Andrews, S. M. 2020, ARA&A, 58, 483 [Google Scholar]
- Andrews, S. M., Huang, J., Pérez, L. M., et al. 2018, ApJ, 869, L41 [NASA ADS] [CrossRef] [Google Scholar]
- Ansdell, M., Williams, J. P., Trapman, L., et al. 2018, ApJ, 859, 21 [NASA ADS] [CrossRef] [Google Scholar]
- Asplund, M., Amarsi, A. M., & Grevesse, N. 2021, A&A, 653, A141 [NASA ADS] [CrossRef] [EDP Sciences] [Google Scholar]
- Banzatti, A., Pascucci, I., Bosman, A. D., et al. 2020, ApJ, 903, 124 [NASA ADS] [CrossRef] [Google Scholar]
- Banzatti, A., Pontoppidan, K. M., Carr, J. S., et al. 2023, ApJ, 957, L22 [NASA ADS] [CrossRef] [Google Scholar]
- Bardyn, A., Baklouti, D., Cottin, H., et al. 2017, MNRAS, 469, S712 [NASA ADS] [CrossRef] [Google Scholar]
- Bate, M. R. 2022, MNRAS, 514, 2145 [CrossRef] [Google Scholar]
- Bergin, E. A., Blake, G. A., Ciesla, F., Hirschmann, M. M., & Li, J. 2015, PNAS, 112, 8965 [NASA ADS] [CrossRef] [Google Scholar]
- Bergin, E. A., Du, F., Cleeves, L. I., et al. 2016, ApJ, 831, 101 [Google Scholar]
- Bergner, J. B., Sturm, J. A., Piacentino, E. L., et al. 2024, ApJ, 975, 166 [NASA ADS] [CrossRef] [Google Scholar]
- Biazzo, K., D’Orazi, V., Desidera, S., et al. 2022, A&A, 664, A161 [NASA ADS] [CrossRef] [EDP Sciences] [Google Scholar]
- Birnstiel, T. 2024, ARA&A, 62, 157 [NASA ADS] [CrossRef] [Google Scholar]
- Birnstiel, T., Dullemond, C. P., & Brauer, F. 2010, A&A, 513, A79 [NASA ADS] [CrossRef] [EDP Sciences] [Google Scholar]
- Bohlin, R. C., Savage, B. D., & Drake, J. F. 1978, ApJ, 224, 132 [Google Scholar]
- Bonsor, A., Lichtenberg, T., Dra˛z˙kowska, J., & Buchan, A. M. 2023, Nat. Astron., 7, 39 [Google Scholar]
- Boogert, A. C. A., Gerakines, P. A., & Whittet, D. C. B. 2015, ARA&A, 53, 541 [Google Scholar]
- Booth, R. A., & Ilee, J. D. 2019, MNRAS, 487, 3998 [CrossRef] [Google Scholar]
- Booth, R. A., Clarke, C. J., Madhusudhan, N., & Ilee, J. D. 2017, MNRAS, 469, 3994 [Google Scholar]
- Bosman, A. D., Alarcón, F., Zhang, K., & Bergin, E. A. 2021, ApJ, 910, 3 [NASA ADS] [CrossRef] [Google Scholar]
- Carleo, I., Giacobbe, P., Guilluy, G., et al. 2022, AJ, 164, 101 [NASA ADS] [CrossRef] [Google Scholar]
- Cevallos Soto, A., Tan, J. C., Hu, X., Hsu, C.-J., & Walsh, C. 2022, MNRAS, 517, 2285 [NASA ADS] [CrossRef] [Google Scholar]
- Chachan, Y., Knutson, H. A., Lothringer, J., & Blake, G. A. 2023, ApJ, 943, 112 [NASA ADS] [CrossRef] [Google Scholar]
- Changeat, Q., Edwards, B., Al-Refaie, A. F., et al. 2022, ApJS, 260, 3 [NASA ADS] [CrossRef] [Google Scholar]
- Chiang, E. I., & Goldreich, P. 1997, ApJ, 490, 368 [Google Scholar]
- Cleeves, L. I., Adams, F. C., Bergin, E. A., & Visser, R. 2013, ApJ, 777, 28 [NASA ADS] [CrossRef] [Google Scholar]
- Colmenares, M. J., Bergin, E. A., Salyk, C., et al. 2024, ApJ, 977, 173 [NASA ADS] [CrossRef] [Google Scholar]
- Consolmagno, G., Britt, D., & Macke, R. 2008, Chem. Erde/ Geochemistry, 68, 1 [CrossRef] [Google Scholar]
- Cridland, A. J., Pudritz, R. E., Birnstiel, T., Cleeves, L. I., & Bergin, E. A. 2017, MNRAS, 469, 3910 [NASA ADS] [CrossRef] [Google Scholar]
- Cridland, A. J., Eistrup, C., & van Dishoeck, E. F. 2019, A&A, 627, A127 [Google Scholar]
- Cridland, A. J., van Dishoeck, E. F., Alessi, M., & Pudritz, R. E. 2020, A&A, 642, A229 [NASA ADS] [CrossRef] [EDP Sciences] [Google Scholar]
- Cridland, A. J., Rosotti, G. P., Tabone, B., et al. 2022, A&A, 662, A90 [NASA ADS] [CrossRef] [EDP Sciences] [Google Scholar]
- Crossfield, I. J. M. 2023, ApJ, 952, L18 [NASA ADS] [CrossRef] [Google Scholar]
- Cuzzi, J. N., & Zahnle, K. J. 2004, ApJ, 614, 490 [NASA ADS] [CrossRef] [Google Scholar]
- da Silva, R., Danielski, C., Delgado Mena, E., et al. 2024, A&A, 688, A193 [NASA ADS] [CrossRef] [EDP Sciences] [Google Scholar]
- D’Alessio, P., Calvet, N., & Woolum, D. S. 2005, in Astronomical Society of the Pacific Conference Series, 341, Chondrites and the Protoplanetary Disk, eds. A. N. Krot, E. R. D. Scott, & B. Reipurth, 353 [Google Scholar]
- Danti, C., Bitsch, B., & Mah, J. 2023, A&A, 679, L7 [NASA ADS] [CrossRef] [EDP Sciences] [Google Scholar]
- Dodson-Robinson, S. E., Willacy, K., Bodenheimer, P., Turner, N. J., & Beich-man, C. A. 2009, Icarus, 200, 672 [NASA ADS] [CrossRef] [Google Scholar]
- Dra˛z˙ kowska, J., Bitsch, B., Lambrechts, M., et al. 2023, in Astronomical Society of the Pacific Conference Series, 534, Protostars and Planets VII, eds. S. Inutsuka, Y. Aikawa, T. Muto, K. Tomida, & M. Tamura, 717 [Google Scholar]
- Dullemond, C. P., & Dominik, C. 2005, A&A, 434, 971 [CrossRef] [EDP Sciences] [Google Scholar]
- Dullemond, C. P., Dominik, C., & Natta, A. 2001, ApJ, 560, 957 [NASA ADS] [CrossRef] [Google Scholar]
- Dullemond, C. P., Isella, A., Andrews, S. M., Skobleva, I., & Dzyurkevich, N. 2020, A&A, 633, A137 [EDP Sciences] [Google Scholar]
- Edwards, B., Changeat, Q., Tsiaras, A., et al. 2023, ApJS, 269, 31 [NASA ADS] [CrossRef] [Google Scholar]
- Eggenberger, P., Buldgen, G., Salmon, S. J. A. J., et al. 2022, Nat. Astron., 6, 788 [NASA ADS] [CrossRef] [Google Scholar]
- Eistrup, C., Walsh, C., & van Dishoeck, E. F. 2016, A&A, 595, A83 [NASA ADS] [CrossRef] [EDP Sciences] [Google Scholar]
- Eistrup, C., Walsh, C., & van Dishoeck, E. F. 2018, A&A, 613, A14 [NASA ADS] [CrossRef] [EDP Sciences] [Google Scholar]
- Eistrup, C., Cleeves, L. I., & Krijt, S. 2022, A&A, 667, A121 [NASA ADS] [CrossRef] [EDP Sciences] [Google Scholar]
- Farihi, J., Koester, D., Zuckerman, B., et al. 2016, MNRAS, 463, 3186 [NASA ADS] [CrossRef] [Google Scholar]
- Fegley, B., & Schaefer, L. 2010, in Astrophysics and Space Science Proceedings, 16, Principles and Perspectives in Cosmochemistry, 347 [Google Scholar]
- Filomeno, S., Biazzo, K., Baratella, M., et al. 2024, A&A, 690, A370 [NASA ADS] [CrossRef] [EDP Sciences] [Google Scholar]
- Flaherty, K. M., Hughes, A. M., Rosenfeld, K. A., et al. 2015, ApJ, 813, 99 [NASA ADS] [CrossRef] [Google Scholar]
- Flaherty, K. M., Hughes, A. M., Teague, R., et al. 2018, ApJ, 856, 117 [CrossRef] [Google Scholar]
- Furuya, K., & Aikawa, Y. 2014, ApJ, 790, 97 [Google Scholar]
- Gail, H.-P., & Trieloff, M. 2017, A&A, 606, A16 [NASA ADS] [CrossRef] [EDP Sciences] [Google Scholar]
- Gänsicke, B. T., Koester, D., Farihi, J., et al. 2012, MNRAS, 424, 333 [CrossRef] [Google Scholar]
- Giacobbe, P., Brogi, M., Gandhi, S., et al. 2021, Nature, 592, 205 [NASA ADS] [CrossRef] [Google Scholar]
- Gkotsinas, A., Nesvorný, D., Guilbert-Lepoutre, A., Raymond, S. N., & Kaib, N. 2024, PSJ, 5, 243 [Google Scholar]
- Guidi, G., Isella, A., Testi, L., et al. 2022, A&A, 664, A137 [NASA ADS] [CrossRef] [EDP Sciences] [Google Scholar]
- Guilluy, G., Giacobbe, P., Carleo, I., et al. 2022, A&A, 665, A104 [NASA ADS] [CrossRef] [EDP Sciences] [Google Scholar]
- Gupta, A., Miotello, A., Manara, C. F., et al. 2023, A&A, 670, L8 [NASA ADS] [CrossRef] [EDP Sciences] [Google Scholar]
- Hayashi, C. 1981, Progr. Theor. Phys. Suppl., 70, 35 [Google Scholar]
- Henning, T., & Semenov, D. 2013, Chem. Rev., 113, 9016 [Google Scholar]
- Houge, A., Johansen, A., Bergin, E., et al. 2025, A&A, 699, A227 [NASA ADS] [CrossRef] [EDP Sciences] [Google Scholar]
- Hueso, R., & Guillot, T. 2005, A&A, 442, 703 [NASA ADS] [CrossRef] [EDP Sciences] [Google Scholar]
- Hühn, L. A., Dullemond, C. P., Lebreuilly, U., et al. 2025, A&A, 696, A162 [NASA ADS] [CrossRef] [EDP Sciences] [Google Scholar]
- Isella, A., Carpenter, J. M., & Sargent, A. I. 2010, ApJ, 714, 1746 [Google Scholar]
- Isella, A., Guidi, G., Testi, L., et al. 2016, Phys. Rev. Lett., 117, 251101 [NASA ADS] [CrossRef] [Google Scholar]
- Jura, M. 2006, ApJ, 653, 613 [NASA ADS] [CrossRef] [Google Scholar]
- Jura, M., Xu, S., Klein, B., Koester, D., & Zuckerman, B. 2012, ApJ, 750, 69 [NASA ADS] [CrossRef] [Google Scholar]
- Kamp, I., Henning, T., Arabhavi, A. M., et al. 2023, Faraday Discuss., 245, 112 [NASA ADS] [CrossRef] [Google Scholar]
- Kanwar, J., Kamp, I., Jang, H., et al. 2024, A&A, 689, A231 [NASA ADS] [CrossRef] [EDP Sciences] [Google Scholar]
- Keyte, L., & Haworth, T. J. 2025, MNRAS, 537, 598 [Google Scholar]
- Kretke, K. A., Levison, H. F., Buie, M. W., & Morbidelli, A. 2012, AJ, 143, 91 [NASA ADS] [CrossRef] [Google Scholar]
- Krijt, S., Bosman, A. D., Zhang, K., et al. 2020, ApJ, 899, 134 [NASA ADS] [CrossRef] [Google Scholar]
- Le Gal, R., Brady, M. T., Öberg, K. I., Roueff, E., & Le Petit, F. 2019, ApJ, 886, 86 [NASA ADS] [CrossRef] [Google Scholar]
- Lebreuilly, U., Commerçon, B., & Laibe, G. 2020, A&A, 641, A112 [EDP Sciences] [Google Scholar]
- Lebreuilly, U., Vallucci-Goy, V., Guillet, V., Lombart, M., & Marchand, P. 2023, MNRAS, 518, 3326 [Google Scholar]
- Lee, J.-E., Bergin, E. A., & Nomura, H. 2010, ApJ, 710, L21 [Google Scholar]
- Lesur, G. 2021, J. Plasma Phys., 87, 205870101 [CrossRef] [Google Scholar]
- Li, J., Bergin, E. A., Blake, G. A., Ciesla, F. J., & Hirschmann, M. M. 2021, Sci. Adv., 7, eabd3632 [NASA ADS] [CrossRef] [Google Scholar]
- Lodders, K. 2010, in Astrophysics and Space Science Proceedings, 16, Principles and Perspectives in Cosmochemistry, 379 [Google Scholar]
- Lynden-Bell, D., & Pringle, J. E. 1974, MNRAS, 168, 603 [Google Scholar]
- Madhusudhan, N. 2019, ARA&A, 57, 617 [NASA ADS] [CrossRef] [Google Scholar]
- Madhusudhan, N., Amin, M. A., & Kennedy, G. M. 2014, ApJ, 794, L12 [Google Scholar]
- Madhusudhan, N., Bitsch, B., Johansen, A., & Eriksson, L. 2017, MNRAS, 469, 4102 [NASA ADS] [CrossRef] [Google Scholar]
- Magrini, L., Danielski, C., Bossini, D., et al. 2022, A&A, 663, A161 [NASA ADS] [CrossRef] [EDP Sciences] [Google Scholar]
- Mah, J., Bitsch, B., Pascucci, I., & Henning, T. 2023, A&A, 677, L7 [CrossRef] [EDP Sciences] [Google Scholar]
- Manara, C. F., Ansdell, M., Rosotti, G. P., et al. 2023, in Astronomical Society of the Pacific Conference Series, 534, Protostars and Planets VII, eds. S. Inutsuka, Y. Aikawa, T. Muto, K. Tomida, & M. Tamura, 539 [Google Scholar]
- Marboeuf, U., Thiabaud, A., Alibert, Y., Cabral, N., & Benz, W. 2014, A&A, 570, A36 [NASA ADS] [CrossRef] [EDP Sciences] [Google Scholar]
- Marchand, P., Lebreuilly, U., Mac Low, M. M., & Guillet, V. 2023, A&A, 670, A61 [NASA ADS] [CrossRef] [EDP Sciences] [Google Scholar]
- Mathis, J. S., Rumpl, W., & Nordsieck, K. H. 1977, ApJ, 217, 425 [Google Scholar]
- McGuire, B. A. 2022, ApJS, 259, 30 [NASA ADS] [CrossRef] [Google Scholar]
- McClure, M. K., Rocha, W. R. M., Pontoppidan, K. M., et al. 2023, Nat. Astron., 7, 431 [NASA ADS] [CrossRef] [Google Scholar]
- Mordasini, C., van Boekel, R., Mollière, P., Henning, T., & Benneke, B. 2016, ApJ, 832, 41 [Google Scholar]
- Mumma, M. J., & Charnley, S. B. 2011, ARA&A, 49, 471 [NASA ADS] [CrossRef] [Google Scholar]
- Nakamoto, T., & Nakagawa, Y. 1994, ApJ, 421, 640 [Google Scholar]
- Navarro-Almaida, D., Lebreuilly, U., Hennebelle, P., et al. 2024, A&A, 685, A112 [NASA ADS] [CrossRef] [EDP Sciences] [Google Scholar]
- Nazari, P., Tabone, B., van’t Hoff, M. L. R., Jørgensen, J. K., & van Dishoeck, E. F. 2023, ApJ, 951, L38 [NASA ADS] [CrossRef] [Google Scholar]
- Öberg, K. I., & Bergin, E. A. 2016, ApJ, 831, L19 [Google Scholar]
- Öberg, K. I., & Wordsworth, R. 2019, AJ, 158, 194 [Google Scholar]
- Öberg, K. I., & Bergin, E. A. 2021, Phys. Rep., 893, 1 [Google Scholar]
- Öberg, K. I., Murray-Clay, R., & Bergin, E. A. 2011, ApJ, 743, L16 [Google Scholar]
- Öberg, K. I., Guzmán, V. V., Walsh, C., et al. 2021, ApJS, 257, 1 [CrossRef] [Google Scholar]
- Öberg, K. I., Facchini, S., & Anderson, D. E. 2023, ARA&A, 61, 287 [CrossRef] [Google Scholar]
- Pacetti, E., Turrini, D., Schisano, E., et al. 2022, ApJ, 937, 36 [NASA ADS] [CrossRef] [Google Scholar]
- Palme, H., Lodders, K., & Jones, A. 2014, in Planets, Asteriods, Comets and The Solar System, 2, ed. A. M. Davis, 15 [Google Scholar]
- Perotti, G., Christiaens, V., Henning, T., et al. 2023, Nature, 620, 516 [NASA ADS] [CrossRef] [Google Scholar]
- Piso, A.-M. A., Öberg, K. I., Birnstiel, T., & Murray-Clay, R. A. 2015, ApJ, 815, 109 [Google Scholar]
- Rosotti, G. P. 2023, New A Rev., 96, 101674 [NASA ADS] [CrossRef] [Google Scholar]
- Rosotti, G. P., Tazzari, M., Booth, R. A., et al. 2019, MNRAS, 486, 4829 [NASA ADS] [CrossRef] [Google Scholar]
- Rubin, M., Altwegg, K., Balsiger, H., et al. 2019, MNRAS, 489, 594 [Google Scholar]
- Savage, B. D., & Sembach, K. R. 1996, ARA&A, 34, 279 [Google Scholar]
- Schneider, A. D., & Bitsch, B. 2021a, A&A, 654, A71 [NASA ADS] [CrossRef] [EDP Sciences] [Google Scholar]
- Schneider, A. D., & Bitsch, B. 2021b, A&A, 654, A72 [NASA ADS] [CrossRef] [EDP Sciences] [Google Scholar]
- Schwarz, K. R., Henning, T., Christiaens, V., et al. 2024, ApJ, 962, 8 [NASA ADS] [CrossRef] [Google Scholar]
- Semenov, D., & Wiebe, D. 2011, ApJS, 196, 25 [Google Scholar]
- Shakura, N. I., & Sunyaev, R. A. 1973, A&A, 24, 337 [NASA ADS] [Google Scholar]
- Spitzer, Lyman, J., & Tomasko, M. G. 1968, ApJ, 152, 971 [Google Scholar]
- Sturm, J. A., McClure, M. K., Beck, T. L., et al. 2023, A&A, 679, A138 [NASA ADS] [CrossRef] [EDP Sciences] [Google Scholar]
- Tabone, B., Bettoni, G., van Dishoeck, E. F., et al. 2023, Nat. Astron., 7, 805 [NASA ADS] [CrossRef] [Google Scholar]
- Tazzari, M., Testi, L., Ercolano, B., et al. 2016, A&A, 588, A53 [NASA ADS] [CrossRef] [EDP Sciences] [Google Scholar]
- Teske, J. K. 2024, ARA&A, 62, 333 [Google Scholar]
- Tsai, S.-M., Lee, E. K. H., Powell, D., et al. 2023, Nature, 617, 483 [CrossRef] [Google Scholar]
- Turrini, D. 2023, The Compositional Dimension of Planet Formation, eds. L. M. Lara, & D. Jewitt (World Scientific Publishing Co Pte Ltd), 1 [Google Scholar]
- Turrini, D., Marzari, F., Polychroni, D., & Testi, L. 2019, ApJ, 877, 50 [NASA ADS] [CrossRef] [Google Scholar]
- Turrini, D., Schisano, E., Fonte, S., et al. 2021, ApJ, 909, 40 [Google Scholar]
- Tychoniec, Ł., Manara, C. F., Rosotti, G. P., et al. 2020, A&A, 640, A19 [NASA ADS] [CrossRef] [EDP Sciences] [Google Scholar]
- Umebayashi, T., & Nakano, T. 1981, PASJ, 33, 617 [NASA ADS] [Google Scholar]
- van der Marel, N., Bosman, A. D., Krijt, S., Mulders, G. D., & Bergner, J. B. 2021, A&A, 653, L9 [NASA ADS] [CrossRef] [EDP Sciences] [Google Scholar]
- van Dishoeck, E. F., Grant, S., Tabone, B., et al. 2023, Faraday Discuss., 245, 52 [NASA ADS] [CrossRef] [Google Scholar]
- van’t Hoff, M. L. R., Bergin, E. A., Jørgensen, J. K., & Blake, G. A. 2020, ApJ, 897, L38 [CrossRef] [Google Scholar]
- Vinyoles, N., Serenelli, A. M., Villante, F. L., et al. 2017, ApJ, 835, 202 [NASA ADS] [CrossRef] [Google Scholar]
- Walsh, C., Nomura, H., & van Dishoeck, E. 2015, A&A, 582, A88 [NASA ADS] [CrossRef] [EDP Sciences] [Google Scholar]
- Wei, C.-E., Nomura, H., Lee, J.-E., et al. 2019, ApJ, 870, 129 [NASA ADS] [CrossRef] [Google Scholar]
- Weidenschilling, S. J. 1977, MNRAS, 180, 57 [Google Scholar]
- Weidenschilling, S. J., & Cuzzi, J. N. 1993, in Protostars and Planets III, eds. E. H. Levy, & J. I. Lunine, 1031 [Google Scholar]
- Youdin, A. N., & Lithwick, Y. 2007, Icarus, 192, 588 [NASA ADS] [CrossRef] [Google Scholar]
- Zhang, K., Bergin, E. A., Schwarz, K., Krijt, S., & Ciesla, F. 2019, ApJ, 883, 98 [Google Scholar]
Appendix A Impact of planetesimal formation
In this appendix, we examine how the composition of the disc changes due to mass transport after the conversion of half of the dust into planetesimals. We assumed that this conversion occurs with the same efficiency throughout the disc and is already completed 105 yr after the zero time we set for a Class II disc in our simulations. For simplicity, we assumed that the composition of the planetesimals is fixed by the composition of the solid phase (refractories and ices) at 105 yr. The evolution of the total elemental abundances in the disc after 105 yr is analysed in detail in Fig. A.1 for the inheritance-low scenario with 0.1 µm-sized grains. Each panel shows the radial abundance profiles of the volatile fractions of C, O, and N in the gas phase (dashed lines) and as ice on the surface of the dust grains (dash-dotted lines) at three times: 105 yr, 103 years later, and after 1 Myr of evolution of the disc with JADE.
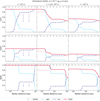 |
Fig. A.1 Radial abundance profiles of volatile C, O, and N in the disc at the time of planetesimal formation (105 yr), 103 years later, and at 1 Myr, shown for the inheritance-low scenario with 0.1 μm-sized grains. The light blue dashed line shows the gas-phase abundance, while the blue dash-dotted line represents the ice-phase abundance (which, for C, includes the contribution from semi-volatile refractory organics). The red solid line is the total abundance (gas + ice), initially set to the protosolar value and reduced by the meteoritic abundance. The plot illustrates the evolution of elemental abundances due to mass transport during viscous disc evolution. |
At 105 yr, the sum of the gas and ice abundances (solid red curve) is constant in the entire disc and results from the difference between the protosolar and meteoritic abundance for each element. After the formation of planetesimals, which effectively represent a chemically inert reservoir of volatile and refractory elements, the abundance of volatile elements that remain in the disc as ice decreases by a factor of 2. Beyond the snowlines, the total abundance of elements in the gas and on the dust is therefore lower than in the inner disc, where all volatile elements are in the gas phase and planetesimals only incorporate refractory elements (centre column in Fig. A.1). If there were no viscous evolution, the discontinuities in total abundance would remain localised at the snowlines. However, viscous evolution leads to mass accretion onto the star and transport of dust grains, together with their ice mantles, from the outer to the inner disc.
Focussing on nitrogen, the total mass of the disc gas within the snowline of NH3 (r ~ 4.5 au) is about 6.5 × 10 4 M⊙, which corresponds to about 1.2% of the total mass of the disc in our model. This mass is accreted to the star in the first 4 × 10⁵ yr (given a mass accretion rate of ~10-9M⊙/yr). On this timescale, the region within the NH3 snowline is thus emptied and replenished with material from the outer disc, which has a lower N abundance in the ice phase. The icy grains that cross the snowline release their N back into the gas phase, which is then depleted in N compared to the initial state. On a timescale of 1 Myr, the total abundance of volatile N in the inner disc gradually settles to the value reached in the outer disc after the formation of planetesimals (lower-right panel in Fig. A.1). The decrease in N gas abundance in the inner disc continues until the icy material from beyond the N2 snowline is also transported inwards, depleting the inner gas phase by even more N2. However, this happens on long timescales that are not captured by our simulations. The effect described above explains why the gas in the inner disc is more depleted in NH3 than in N2 (see the molecular abundance profiles in Fig. 7). Similar arguments also apply to the molecular carriers of C and O and explain the general decrease in their abundance in the gas and ice phase after 3 Myr compared to the initial values (Fig. 6). A direct consequence of this process is that the viscosity-driven physical evolution of the disc can lead to substellar compositions of the gas in the inner disc, independent of chemical processes. The same analysis is shown in Fig. A.2 for the reset-low scenario.
Appendix B Elemental ratios at high ionisation
In this appendix, we present the radial and temporal evolution of the gas- and solid-phase C/O (Fig. B.1), C/N (Fig. B.2), and N/O (Fig. B.3) ratios in the inheritance and reset scenarios under high ionisation, for all three grain size cases: 0.1, 20, and 100 μm. Elemental abundances are derived from the molecular abundance profiles returned by each simulation, considering only species with abundances above 10-7 relative to total hydrogen nuclei. Solid-phase ratios include contributions from rocks, ice mantles, and refractory organic carbon. All elemental ratios are normalised to their respective stellar value.
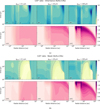 |
Fig. B.1 Same as Fig. 8 for the inheritance (panel a) and reset (panel b) scenarios with high ionisation. |
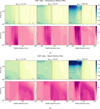 |
Fig. B.2 Same as Fig. 10 for the inheritance (panel a) and reset (panel b) scenarios with high ionisation. |
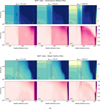 |
Fig. B.3 Same as Fig. 11 for the inheritance (panel a) and reset (panel b) scenarios with high ionisation. |
Appendix C Total elemental ratios of volatiles
In Fig. C.1, we present the radial and temporal evolution of the total elemental ratios of the volatile component, defined here as the sum of gas and ice mantles, for the three grain size scenarios in the inheritance case with low ionisation. The evolution is shown from 105 yr onwards, that is, after the onset of planetesimal formation, which removes solids from the disc. The plotted ratios are normalised to their respective stellar values, and the dark contour indicates where the ratio equals the stellar value. As a consequence of the initial distribution of elements across volatiles, rocks, and semi-refractory organic carbon, the disc starts with radial gradients in the volatile elemental ratios. The volatile C/O ratio is initially substellar in the outer disc and becomes superstellar inside 5 au, where semi-refractory organic carbon (Cref) transitions to the gas phase. The C/N ratio closely follows the carbon distribution due to the high volatility of nitrogen: it is strongly substellar in the outer disc and increases towards the inner disc, becoming superstellar only in scenarios with efficient radial drift (100 μm-sized grains) after ~0.4 Myr. The N/O ratio is initially superstellar across the disc due to the sequestration of a large fraction of oxygen in phyllosilicates and other refractory minerals, and becomes substellar only in the 100 μm grain scenario after ~1 Myr, within the H2O snowline.
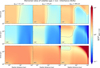 |
Fig. C.1 Total elemental ratios of the volatile component (i.e. including only gas and ice mantles) as a function of radial position and time in the disc, for the three considered grain sizes in the inheritance scenario with low ionisation. All values are normalised to the respective stellar ratio, with the normalisation indicated by the superscript ∗. The dark contour represents a value of 1, corresponding to the stellar ratio. |
Access to this private package is available upon request to C.P. Dullemond: This email address is being protected from spambots. You need JavaScript enabled to view it.
All Tables
Initial conditions for chemistry: elemental abundances with respect to total H nuclei in the initial gas mixture (protosolar), in rocks (meteoritic) and in the residual gas after condensation of rocks.
Initial abundances of volatile species with respect to total H-nuclei in the inheritance and reset scenarios, together with their binding energies.
All Figures
|
Fig. 1 Flowchart showing the initialisation of JADE and the operations performed in a single iteration of the code, following an operatorsplitting scheme. |
| In the text | |
|
Fig. 2 Left: initial radial profile of the midplane temperature (solid) together with the contributions of stellar irradiation (dashed) and viscous heating (dash-dotted). The temperature reaches a minimum value of 10 K in the outer disc. Right: initial ionisation profiles in the midplane. The orange (dash-dotted) curve indicates the contribution of SLRs and characterises the ionisation environment in the low scenario. The green (solid) curve shows the total ionisation taking into account an additional contribution from CRs (light green curve) and characterises the ionisation environment in the high scenario. |
| In the text | |
|
Fig. 3 Radial abundance profiles of the main C-, O- (left), and N-bearing (right) volatile molecules in the gas phase (dotted lines) and in the ice phase (solid lines) in the disc midplane after 3 Myr of chemical evolution without mass transport in the disc (stationary disc). The results are shown for the four chemical scenarios assuming a grain size of 0.1 μm. The horizontal small arrows indicate the initial abundances of H2O, CO, CO2, CH3OH, CH4, N2, and NH3 in the gas phase in the inheritance scenario (see also Table 2); note that CO and CO2, as well as N2 and NH3, share the same initial abundance. The black profile (CRC), represents the cumulative abundance of additional carbon-rich compounds, including carbon chains, hydrocarbons, nitriles, and other complex organics that are not among the dominant volatile carriers. |
| In the text | |
|
Fig. 4 Evolution of the surface density of the gas (violet curves) and the dust (pink curves) in the three scenarios with grains of size 0.1 μm, 20 μm, and 100 μm, assuming α = 10-3. The solid lines represent the initial conditions at t = 104 yr, while the dotted, dashed, and dash-dotted lines show the evolved profiles at 0.1, 1, and 3 Myr, respectively. The effect of the inward radial drift of the dust relative to the gas becomes stronger with increasing grain size. Note that the surface density of the dust does not include the mass contribution of the ice mantles beyond the snowlines. |
| In the text | |
|
Fig. 5 Radial profiles of the mass accretion flux in the disc midplane in units of solar masses of gas per year. The plot shows the mass flux computed at the edges of each grid point at t = 104 yr (solid curve) and t = 3 Myr (dashed curve), corresponding to the beginning and the end of our simulations, respectively. The accretion flux is positive up to about 120 au and then becomes negative. A positive (negative) accretion flux indicates gas transport towards (away from) the star, which is consistent with the predictions of viscous evolution. |
| In the text | |
|
Fig. 6 Radial abundance profiles of the main C- and O-bearing volatile molecules in the gas phase (dotted lines) and in the ice phase (solid lines) in the disc midplane after 3 Myr of evolution with the time-dependent model (full model). The results are shown for the four chemical scenarios and the three investigated grain sizes assuming α = 10-3. The horizontal small arrows indicate the initial abundances of H2O, CO, CO2, CH3OH, and CH4 in the gas phase in the inheritance scenario (see also Table 2). Note that CO and CO2 have the same initial abundance. The black profile (CRC), represents the cumulative abundance of additional carbon-rich compounds, including carbon chains, hydrocarbons, nitriles, and other complex organics. |
| In the text | |
|
Fig. 7 Radial abundance profiles of the main N-bearing volatile molecules in the gas phase (dotted lines) and in the ice phase (solid lines) in the disc midplane after 3 Myr of evolution with the time-dependent model (full model). The results are shown for the four chemical scenarios and the three investigated grain sizes assuming α = 10-3. The horizontal small arrows indicate the initial abundance of N2 and NH3 in the gas phase in the inheritance scenario (see also Table 2). |
| In the text | |
|
Fig. 8 C/O ratio in the disc as a function of distance and time for the inheritance (panel a) and reset (panel b) scenarios with low ionisation. In each panel, the top row represents the gas phase, while the bottom row shows the solid phase (including rocks, ice mantles, and refractory organic carbon). All values are normalised to the stellar C/O ratio (∼0.59), with normalisation indicated by the superscript∗. The dark contour represent a value of 1, corresponding to the stellar ratio. Vertical lines indicate the approximate locations of key snowlines at 2 Myr. Molecules are labelled only in the top-left plot of each panel but follow the same order in the other plots. |
| In the text | |
|
Fig. 9 Evolution of carbon abundance at 3 au in the inheritance-low scenario, assuming dust grains with a radius of 20 μm. The solid lines represent the total carbon in the gas (light blue) and ice (dark blue) phases, while the dashed lines isolate the contribution of CRC. The grey dash-dotted line indicates the combined total of all contributions. |
| In the text | |
|
Fig. 10 C/N ratio in the disc as a function of distance and time for the inheritance (panel a) and reset (panel b) scenarios with low ionisation. In each panel, the top row represents the gas phase, while the bottom row shows the solid phase (including rocks, ice mantles, and refractory organic carbon). All values are normalised to the stellar C/N ratio (∼4.27), with normalisation indicated by the superscript ∗. The dark contour represents a value of 1, corresponding to the stellar ratio. Vertical lines indicate the approximate locations of key snowlines at 2 Myr. Molecules are labelled only in the top-left plot of each panel but follow the same order in the other plots. For clarity, the NH3 snowline in either scenario is not shown, however, we note that it lies within the shaded region between the Cref and CO2 snowlines. |
| In the text | |
|
Fig. 11 N/O ratio in the disc as a function of distance and time for the inheritance (panel a) and reset (panel b) scenarios with low ionisation. In each panel, the top row represents the gas phase, while the bottom row shows the solid phase (including rocks, ice mantles, and refractory organic carbon). All values are normalised to the stellar N/O ratio (∼0.14), with normalisation indicated by the superscript ∗. The dark contour represents a value of 1, corresponding to the stellar ratio. Vertical lines indicate the approximate locations of key snowlines at 2 Myr. Molecules are labelled only in the top-left plot of each panel but follow the same order in the other plots. For clarity, the NH3 snowline in the reset scenario is not shown but lies within the shaded region between the HCN and CO2 snowlines. |
| In the text | |
|
Fig. 12 Evolutionary tracks of the elemental ratios over 3 Myr across all considered scenarios. Ratios are shown in pairs across four key compositional regions: within the H2O snowline (region 1, top-left), between the H2O and CO2 snowlines (region 2, top-right), between the CO2 and CH4 snowlines (region 3, bottom-left), and beyond the CH4 snowline (region 4, bottom-right). Values represent gas-phase elemental ratios, calculated from total elemental abundances averaged over the radial extent of each region and weighted by the surface density of the gas. The colour bars indicate the four chemical scenarios, with time progressing from lighter to darker shades. The three different markers represent the selected grain sizes and are placed along each track every 200 000 yr. The dark marker on each track denotes 1 Myr. Dashed grey lines highlight regions of the parameter space where pairwise comparisons of the elemental ratios provide constraints on specific scenarios or subsets of scenarios. |
| In the text | |
|
Fig. A.1 Radial abundance profiles of volatile C, O, and N in the disc at the time of planetesimal formation (105 yr), 103 years later, and at 1 Myr, shown for the inheritance-low scenario with 0.1 μm-sized grains. The light blue dashed line shows the gas-phase abundance, while the blue dash-dotted line represents the ice-phase abundance (which, for C, includes the contribution from semi-volatile refractory organics). The red solid line is the total abundance (gas + ice), initially set to the protosolar value and reduced by the meteoritic abundance. The plot illustrates the evolution of elemental abundances due to mass transport during viscous disc evolution. |
| In the text | |
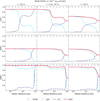 |
Fig. A.2 Same as Fig. A.1 for the reset-low scenario. |
| In the text | |
|
Fig. B.1 Same as Fig. 8 for the inheritance (panel a) and reset (panel b) scenarios with high ionisation. |
| In the text | |
|
Fig. B.2 Same as Fig. 10 for the inheritance (panel a) and reset (panel b) scenarios with high ionisation. |
| In the text | |
|
Fig. B.3 Same as Fig. 11 for the inheritance (panel a) and reset (panel b) scenarios with high ionisation. |
| In the text | |
|
Fig. C.1 Total elemental ratios of the volatile component (i.e. including only gas and ice mantles) as a function of radial position and time in the disc, for the three considered grain sizes in the inheritance scenario with low ionisation. All values are normalised to the respective stellar ratio, with the normalisation indicated by the superscript ∗. The dark contour represents a value of 1, corresponding to the stellar ratio. |
| In the text | |
Current usage metrics show cumulative count of Article Views (full-text article views including HTML views, PDF and ePub downloads, according to the available data) and Abstracts Views on Vision4Press platform.
Data correspond to usage on the plateform after 2015. The current usage metrics is available 48-96 hours after online publication and is updated daily on week days.
Initial download of the metrics may take a while.