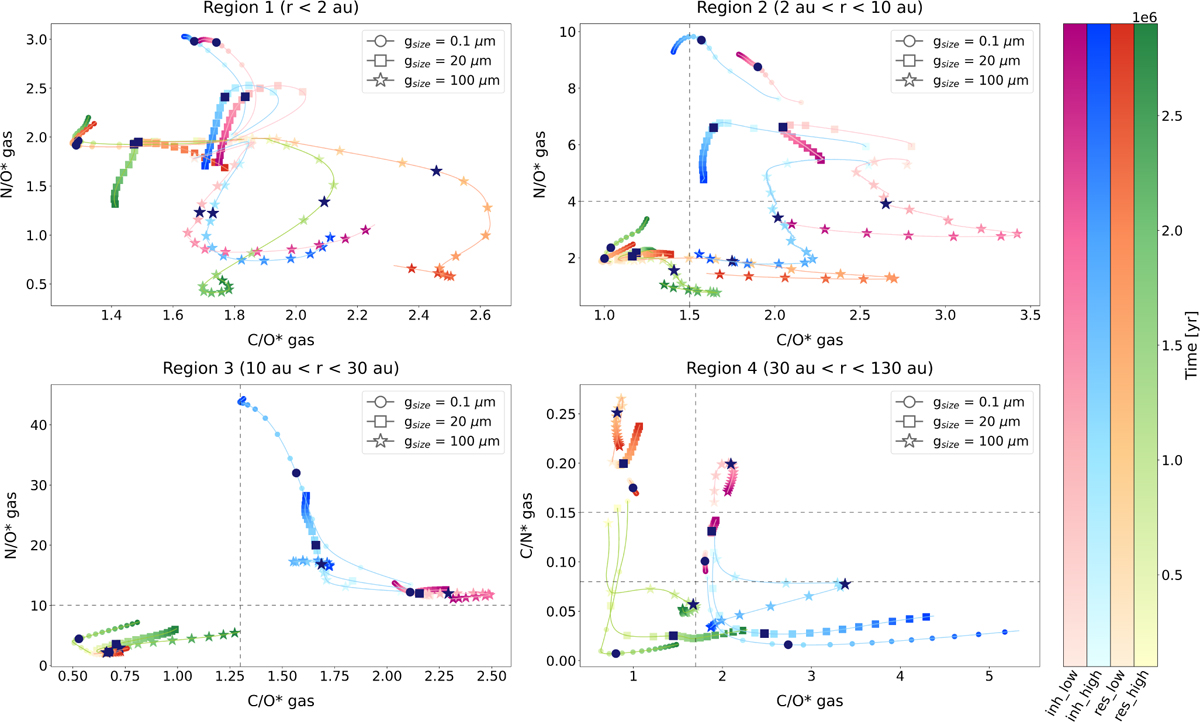
Fig. 12
Download original image
Evolutionary tracks of the elemental ratios over 3 Myr across all considered scenarios. Ratios are shown in pairs across four key compositional regions: within the H2O snowline (region 1, top-left), between the H2O and CO2 snowlines (region 2, top-right), between the CO2 and CH4 snowlines (region 3, bottom-left), and beyond the CH4 snowline (region 4, bottom-right). Values represent gas-phase elemental ratios, calculated from total elemental abundances averaged over the radial extent of each region and weighted by the surface density of the gas. The colour bars indicate the four chemical scenarios, with time progressing from lighter to darker shades. The three different markers represent the selected grain sizes and are placed along each track every 200 000 yr. The dark marker on each track denotes 1 Myr. Dashed grey lines highlight regions of the parameter space where pairwise comparisons of the elemental ratios provide constraints on specific scenarios or subsets of scenarios.
Current usage metrics show cumulative count of Article Views (full-text article views including HTML views, PDF and ePub downloads, according to the available data) and Abstracts Views on Vision4Press platform.
Data correspond to usage on the plateform after 2015. The current usage metrics is available 48-96 hours after online publication and is updated daily on week days.
Initial download of the metrics may take a while.