Fig. 2
Download original image
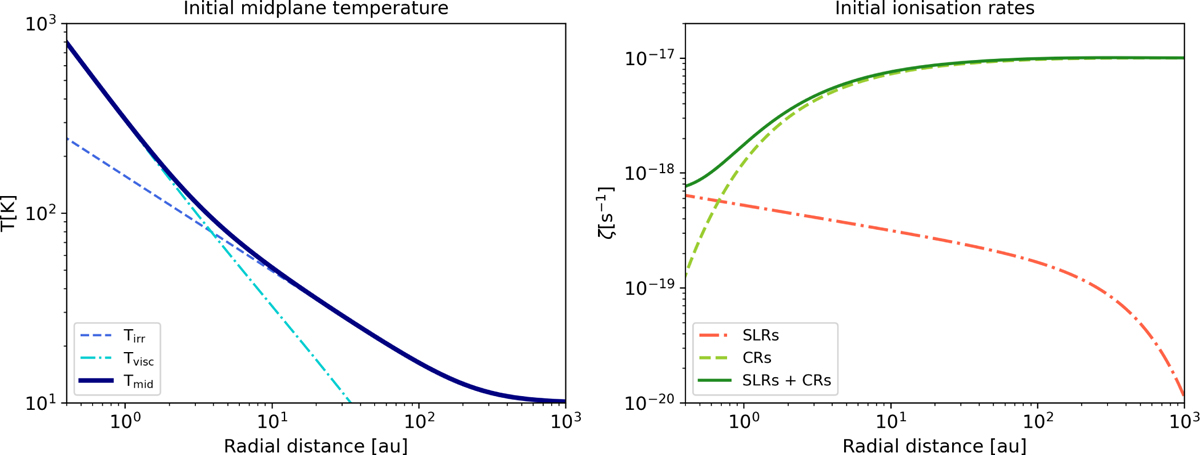
Left: initial radial profile of the midplane temperature (solid) together with the contributions of stellar irradiation (dashed) and viscous heating (dash-dotted). The temperature reaches a minimum value of 10 K in the outer disc. Right: initial ionisation profiles in the midplane. The orange (dash-dotted) curve indicates the contribution of SLRs and characterises the ionisation environment in the low scenario. The green (solid) curve shows the total ionisation taking into account an additional contribution from CRs (light green curve) and characterises the ionisation environment in the high scenario.
Current usage metrics show cumulative count of Article Views (full-text article views including HTML views, PDF and ePub downloads, according to the available data) and Abstracts Views on Vision4Press platform.
Data correspond to usage on the plateform after 2015. The current usage metrics is available 48-96 hours after online publication and is updated daily on week days.
Initial download of the metrics may take a while.