Fig. 4
Download original image
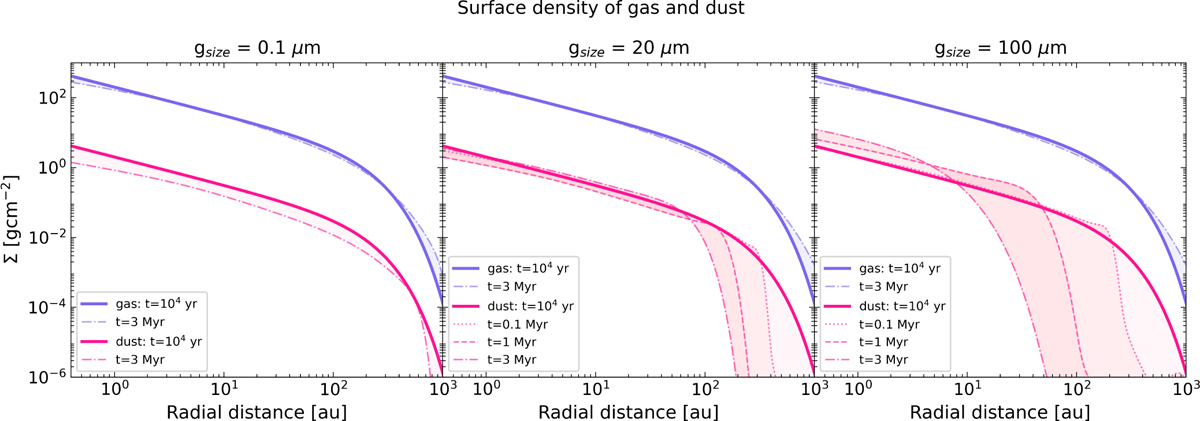
Evolution of the surface density of the gas (violet curves) and the dust (pink curves) in the three scenarios with grains of size 0.1 μm, 20 μm, and 100 μm, assuming α = 10-3. The solid lines represent the initial conditions at t = 104 yr, while the dotted, dashed, and dash-dotted lines show the evolved profiles at 0.1, 1, and 3 Myr, respectively. The effect of the inward radial drift of the dust relative to the gas becomes stronger with increasing grain size. Note that the surface density of the dust does not include the mass contribution of the ice mantles beyond the snowlines.
Current usage metrics show cumulative count of Article Views (full-text article views including HTML views, PDF and ePub downloads, according to the available data) and Abstracts Views on Vision4Press platform.
Data correspond to usage on the plateform after 2015. The current usage metrics is available 48-96 hours after online publication and is updated daily on week days.
Initial download of the metrics may take a while.