Fig. 5
Download original image
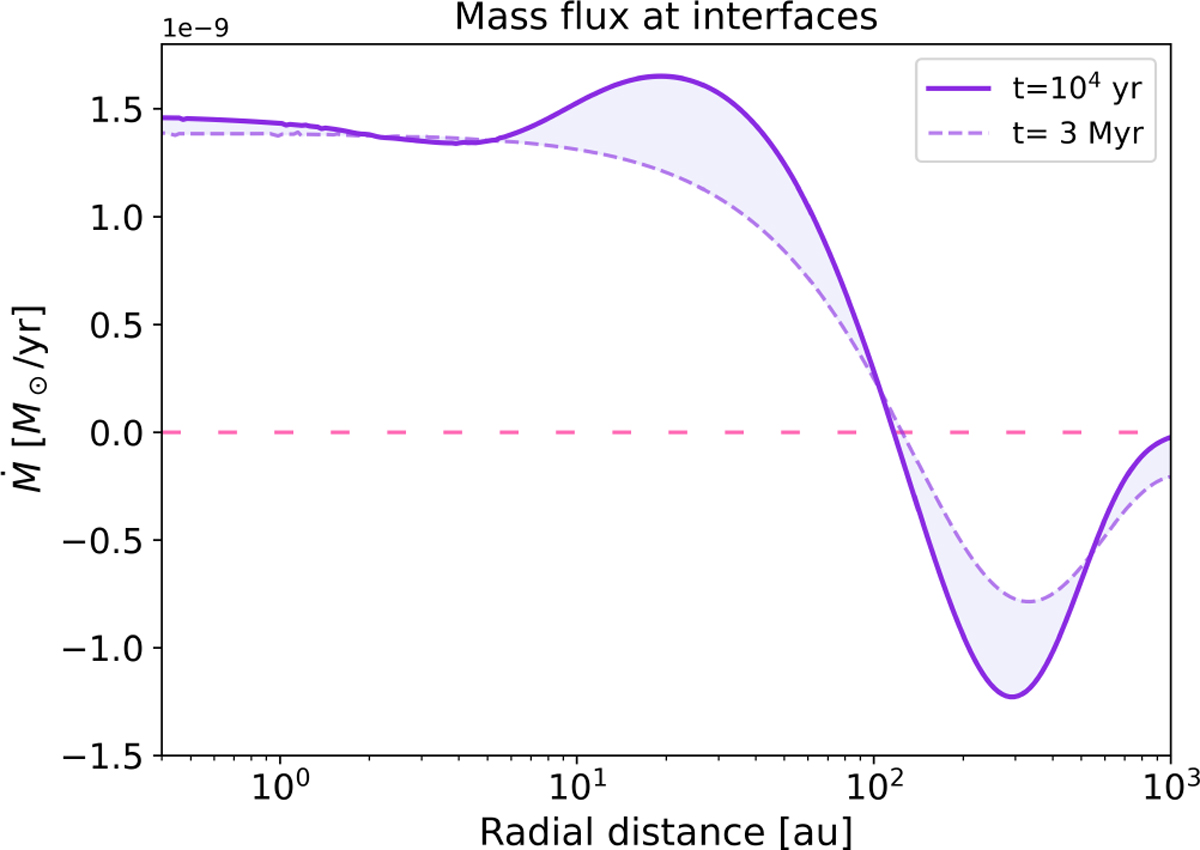
Radial profiles of the mass accretion flux in the disc midplane in units of solar masses of gas per year. The plot shows the mass flux computed at the edges of each grid point at t = 104 yr (solid curve) and t = 3 Myr (dashed curve), corresponding to the beginning and the end of our simulations, respectively. The accretion flux is positive up to about 120 au and then becomes negative. A positive (negative) accretion flux indicates gas transport towards (away from) the star, which is consistent with the predictions of viscous evolution.
Current usage metrics show cumulative count of Article Views (full-text article views including HTML views, PDF and ePub downloads, according to the available data) and Abstracts Views on Vision4Press platform.
Data correspond to usage on the plateform after 2015. The current usage metrics is available 48-96 hours after online publication and is updated daily on week days.
Initial download of the metrics may take a while.