Fig. 9
Download original image
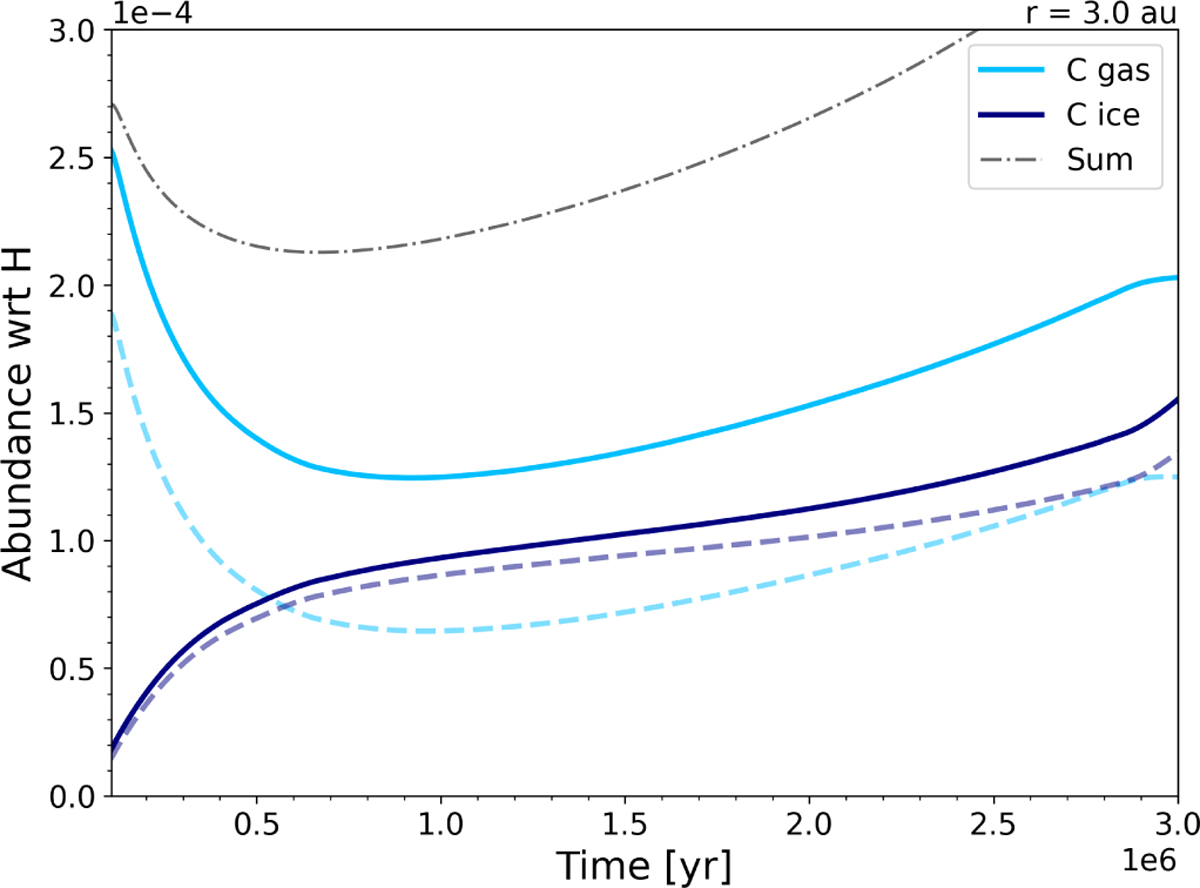
Evolution of carbon abundance at 3 au in the inheritance-low scenario, assuming dust grains with a radius of 20 μm. The solid lines represent the total carbon in the gas (light blue) and ice (dark blue) phases, while the dashed lines isolate the contribution of CRC. The grey dash-dotted line indicates the combined total of all contributions.
Current usage metrics show cumulative count of Article Views (full-text article views including HTML views, PDF and ePub downloads, according to the available data) and Abstracts Views on Vision4Press platform.
Data correspond to usage on the plateform after 2015. The current usage metrics is available 48-96 hours after online publication and is updated daily on week days.
Initial download of the metrics may take a while.