Fig. 1
Download original image
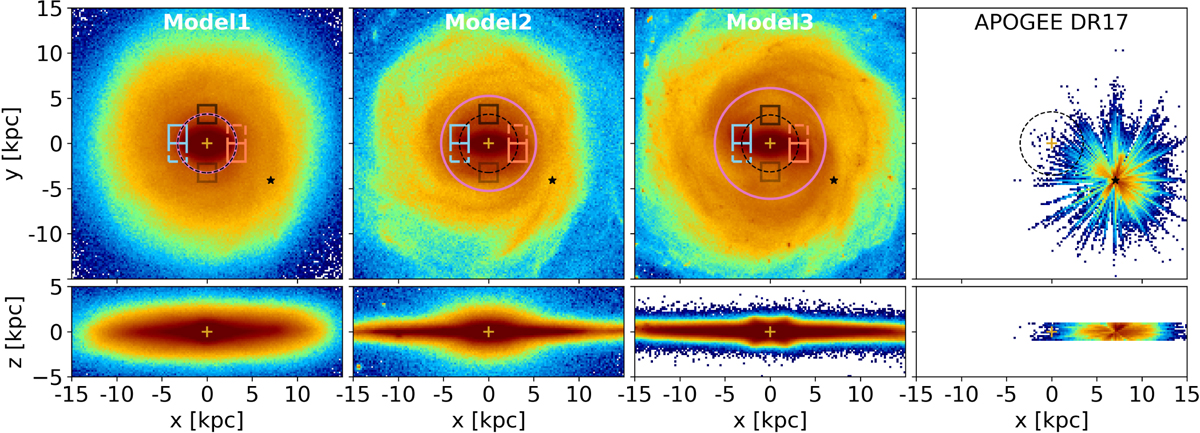
Face-on (top row) and edge-on (bottom row) density map of the three models (from left to right) at the last snapshots, and the APOGEE DR17 sample used (right). The dashed black circle indicates the bar length, while the pink circle indicates the bar CR. They coincide for Model1. The black star indicates the location of the (simulated) Sun. Rotation is in the counterclockwise direction. The 2 × 2 kpc2 squares show the regions that will be studied in Figs. 4, 5, 8, and 10. Light blue indicates the left side of the bar, while orange indicates the right side of the bar. The solid squares are on the trailing side of the bar, while the dashed squares are on the leading side of the bar, although leading and trailing sides will not be differentiated in Sect. 5 (only one 2 × 2-kpc2 square per edge). The black and gray color indicates squares along the bar minor axis. These two squares will be stacked together and averaged in Sect. 4.
Current usage metrics show cumulative count of Article Views (full-text article views including HTML views, PDF and ePub downloads, according to the available data) and Abstracts Views on Vision4Press platform.
Data correspond to usage on the plateform after 2015. The current usage metrics is available 48-96 hours after online publication and is updated daily on week days.
Initial download of the metrics may take a while.