Fig. 10
Download original image
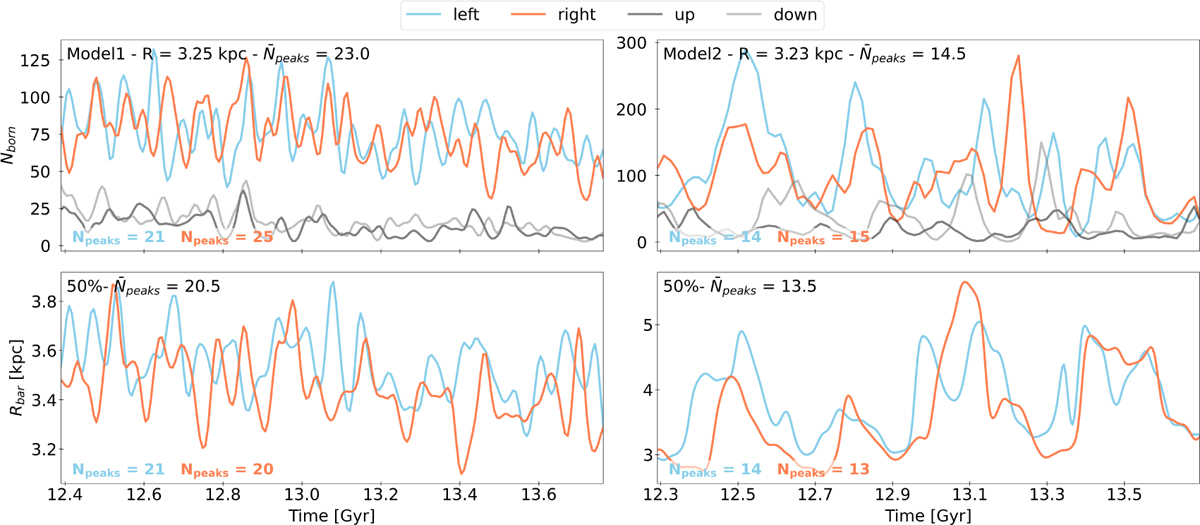
Comparison of the time evolution of the star formation in the four square regions used in Fig. 8 (top row) to that of the bar half-length (bottom row), for Model1 and Model2 (left and right column, respectively). Peaks in Rbar correspond to the times of bar-spiral connection. The frequency of these bar length peaks coincides with the frequency of the starbursts seen in the top panel (see number of peaks Npeaks in each panel), which suggests their correlation with the periodic bar-spiral overlaps. Starbursts do not always happen at the same time at the two ends of the bar.
Current usage metrics show cumulative count of Article Views (full-text article views including HTML views, PDF and ePub downloads, according to the available data) and Abstracts Views on Vision4Press platform.
Data correspond to usage on the plateform after 2015. The current usage metrics is available 48-96 hours after online publication and is updated daily on week days.
Initial download of the metrics may take a while.