Fig. A.1
Download original image
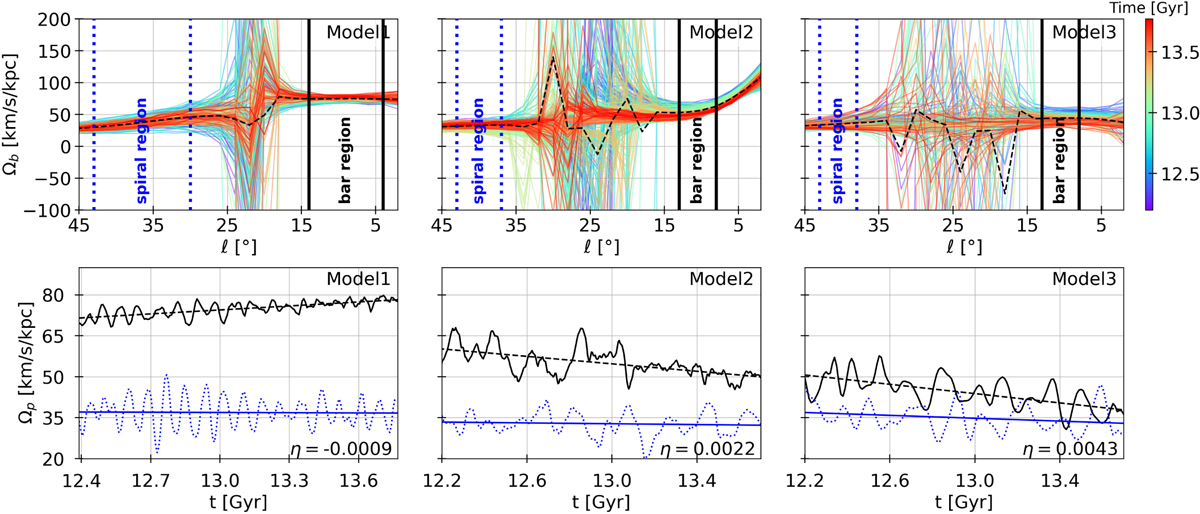
Bar pattern speeds of the three models under study from left to right, as measured using the TW method. Top panel: Pattern speed as a function of galactic longitude, the color of the curve indicating the time at which the measurement was made. At longitudes of 15 to 35 degrees, the TW method fails to give meaningful results because the assumption that only one pattern is rotating is not verified: this is where the bar and the spiral overlap. Two different pattern speeds are seen on the two sides of this interface region: the bar at lower longitudes, the spiral’s at higher longitudes. Bottom panel: Pattern speed of both the bar (black) and the spiral (blue) as a function of time, as averaged in the longitude ranges indicated in the top panel. Pattern speeds of the bar and the spiral both oscillate on the timescale of their beat frequency, and their coupling causes their pattern speed to anticorrelate, as shown by Hilmi et al. (2020). A linear regression of the pattern speeds is plotted as a dashed line, showing their global evolution. While the bars in Model2 and Model3 slow down, the bar in Model1 is speeding up.
Current usage metrics show cumulative count of Article Views (full-text article views including HTML views, PDF and ePub downloads, according to the available data) and Abstracts Views on Vision4Press platform.
Data correspond to usage on the plateform after 2015. The current usage metrics is available 48-96 hours after online publication and is updated daily on week days.
Initial download of the metrics may take a while.