Open Access
Fig. B.2
Download original image
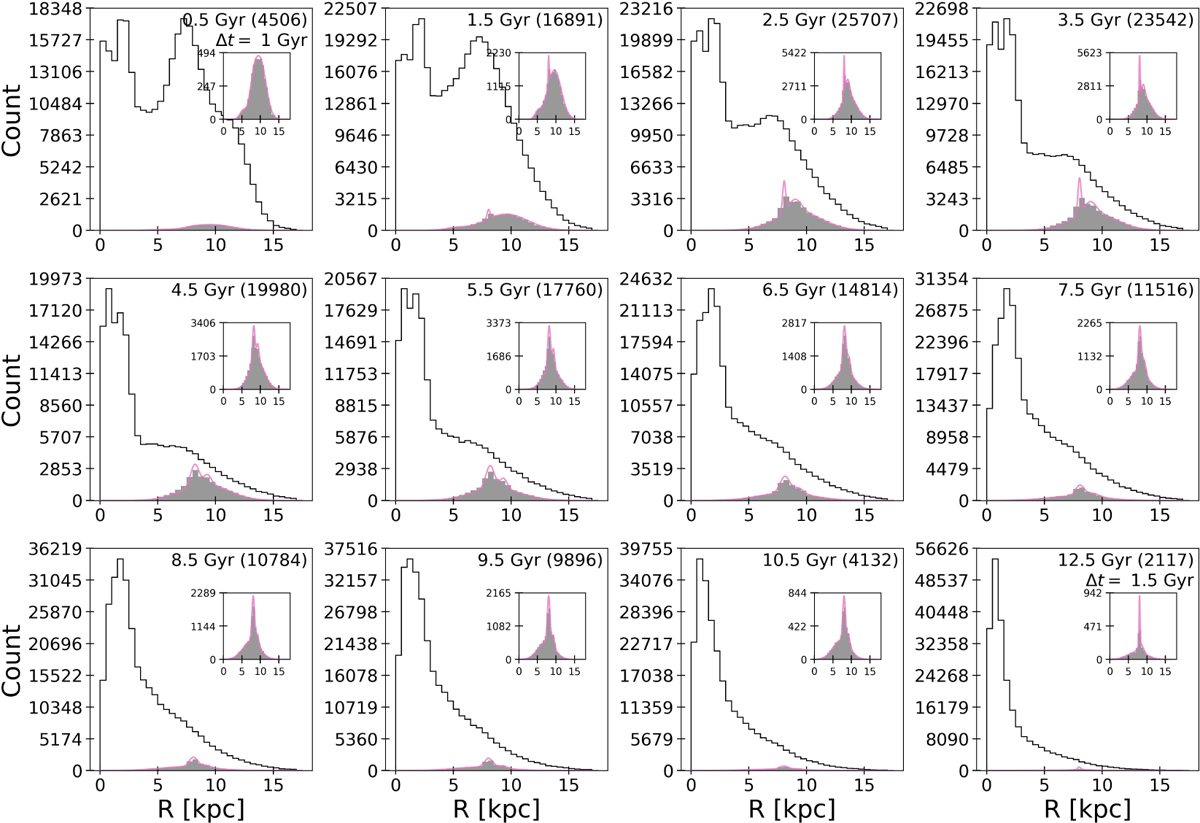
Final stars (filled gray) chosen from the total simulation (black line). They were selected so that each monoage populations of the sample are similarly radially distributed as in the APOGEE sample (pink lines).
Current usage metrics show cumulative count of Article Views (full-text article views including HTML views, PDF and ePub downloads, according to the available data) and Abstracts Views on Vision4Press platform.
Data correspond to usage on the plateform after 2015. The current usage metrics is available 48-96 hours after online publication and is updated daily on week days.
Initial download of the metrics may take a while.