Fig. C.1
Download original image
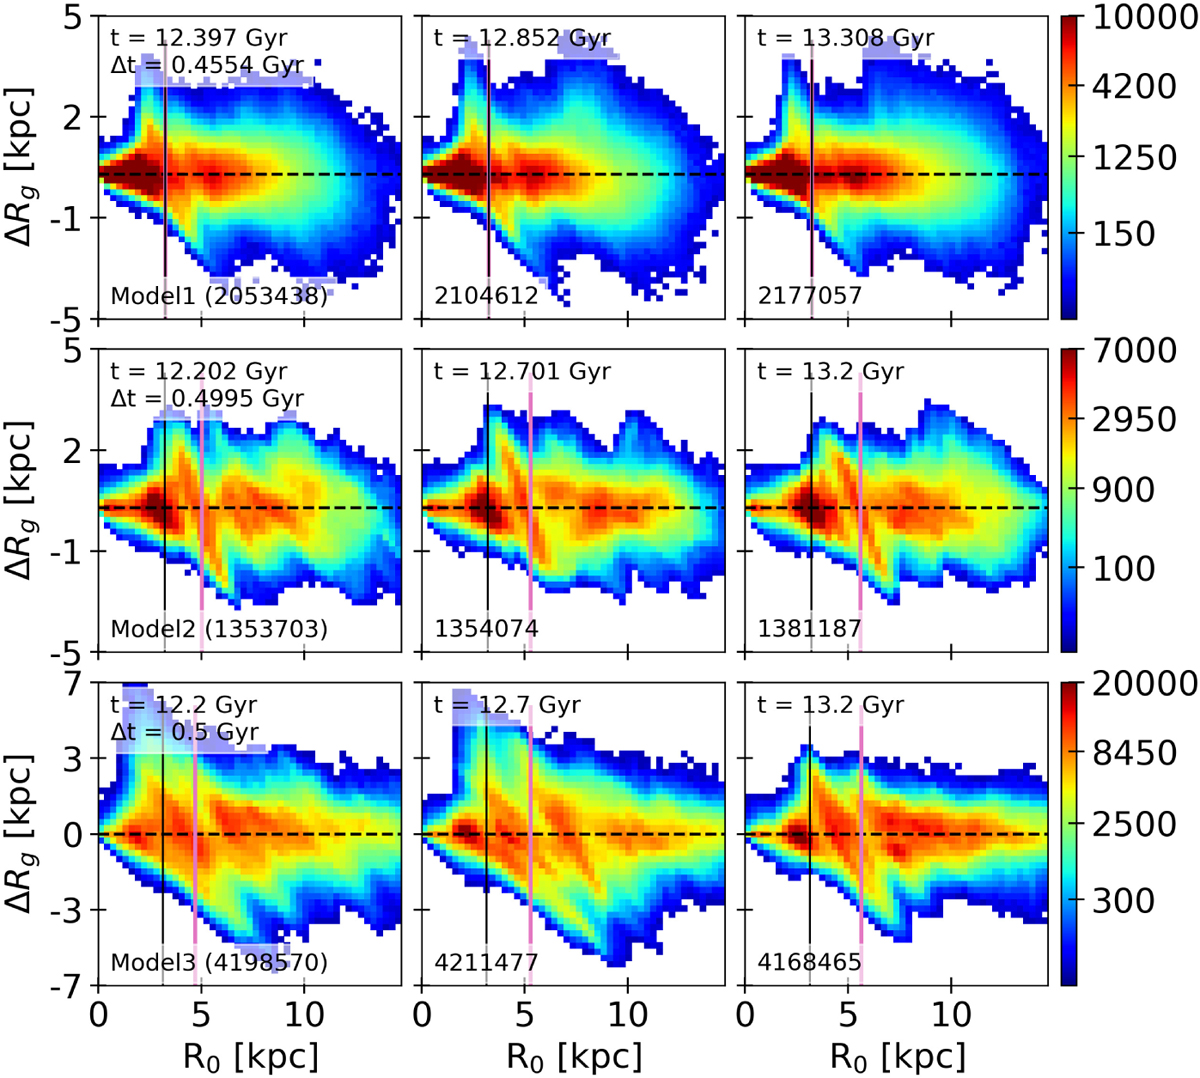
2D-histograms of the change in guiding radius ∆Rg between two snapshots separated by ∆t = 0.5 Gyr, with respect to the initial guiding radius R0. From top to bottom, each row represents stars from Model1, Model2 and Model3. Each column represents a different time in the galaxies’ evolution, increasing from left to right. These times are taken randomly, and the time interval is bigger than that used in section 4. The solid black and pink lines indicate respectively the bar radius and the CR. Strong ridges near these two radii are present in all models. However, the varying amplitude seen in Fig. 2 are not visible here. Model3 shows decreasing ridge amplitude, most likely as a sign of the galaxy getting hotter with time through numerical heating and absence of cold gas accretion (so less sensitive to perturbations).
Current usage metrics show cumulative count of Article Views (full-text article views including HTML views, PDF and ePub downloads, according to the available data) and Abstracts Views on Vision4Press platform.
Data correspond to usage on the plateform after 2015. The current usage metrics is available 48-96 hours after online publication and is updated daily on week days.
Initial download of the metrics may take a while.