Fig. 2
Download original image
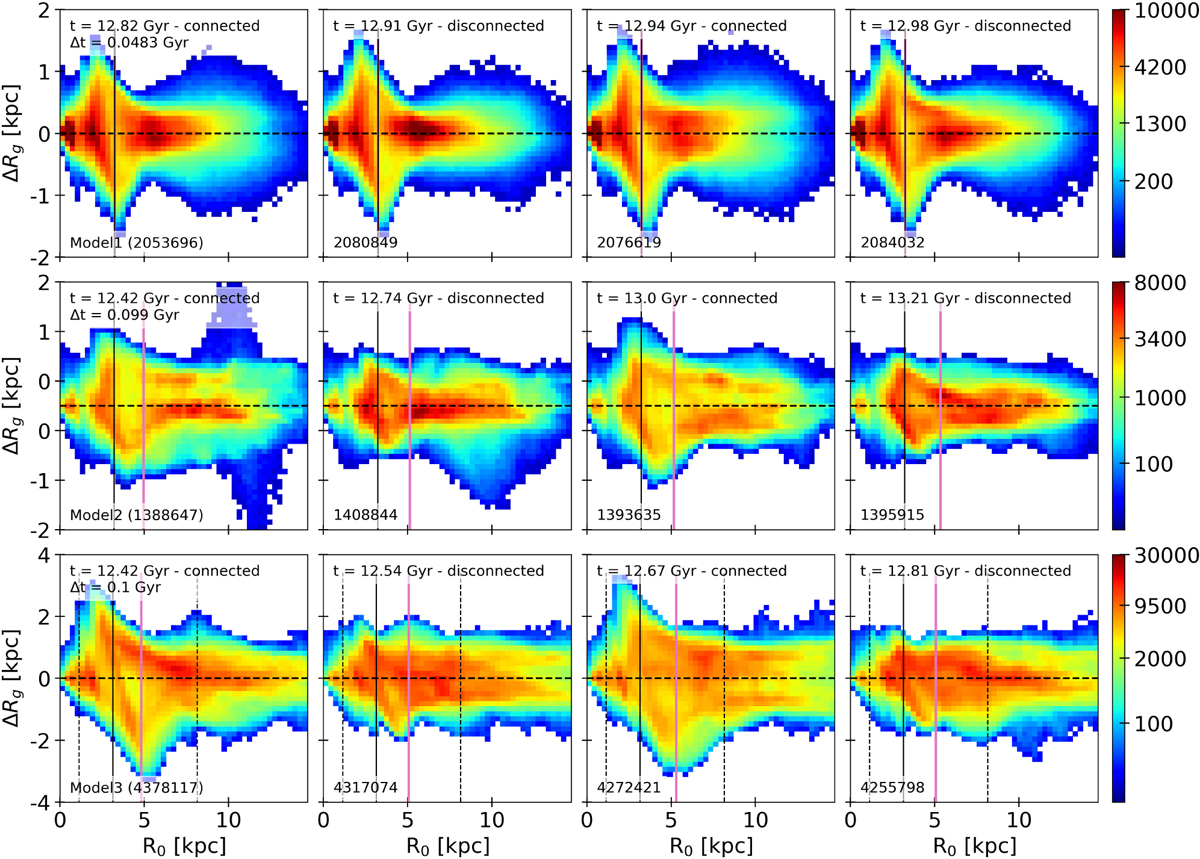
Change of guiding radius over ∆t = 0.1 Gyr vs. initial guiding radius for Modell, Model2, and Model3 stars from top to bottom. Each column represents a different initial time, which increases from left to right as indicated in the top of each panel. These times were chosen to be at moments when the bar and the spiral are connected or disconnected. The dashed horizontal black line shows ∆Rg = 0, (i.e., no migration). All points above (below) this line represent stars that migrated outward (inward). The solid black line indicates the bar length, while the pink line indicates the bar corotation radius. They coincide for Model1. The vertical dashed lines in the bottom panel indicate the radial range over which the azimuthal variations of migration are investigated in Fig. 3. Panels corresponding to bar-spiral connection times show a very prominent ridge at the bar end, while this ridge is much less pronounced at bar-spiral disconnection times, except for Model1 where the weak spirals diminish this effect.
Current usage metrics show cumulative count of Article Views (full-text article views including HTML views, PDF and ePub downloads, according to the available data) and Abstracts Views on Vision4Press platform.
Data correspond to usage on the plateform after 2015. The current usage metrics is available 48-96 hours after online publication and is updated daily on week days.
Initial download of the metrics may take a while.