Fig. 3
Download original image
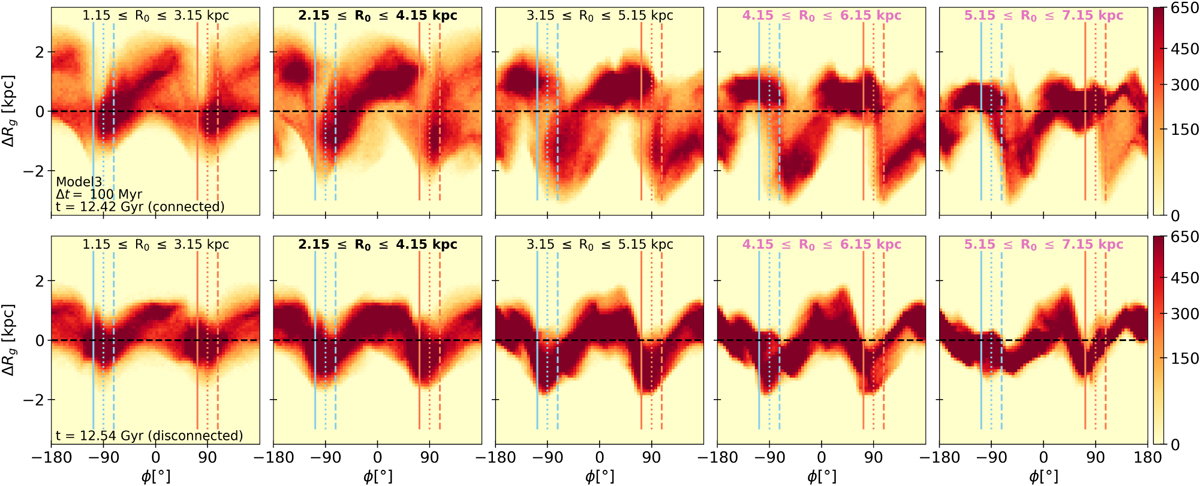
Two-dimensional histograms of the change in guiding radius over ∆t = 0.1 Gyr with respect to the initial azimuthal angle for stars in Model3 initially in different 2-kpc-wide radial bins. Each column is for a different radial bin, going further out from left to right as indicated in each panel. The bar ends (Rbar = 3.15 kpc) are encompassed in the second column and are indicated by the bold text, while the corotation (RCR = 5.3 kpc) is at the border of the fourth and fifth bins and is indicated in pink. The left and right sides of the bar are shown by the light blue and orange vertical dotted lines, respectively. The solid lines indicate the trailing side of the bar edges, while the dashed lines indicate their leading sides. Those lines are located at the edge of their associated square regions from Fig. 1. The different rows represent the same quantities at different times in the disk evolution. They are the same times as those in the first two columns of Fig. 2, and thus show a time at which the bar is connected to a spiral (first row), as well as a time when the bar is not connected to any spiral (second row). The (φ-∆Rg) plane of Fig. 3 is divided into 5° × 0.1 kpc bins and the number of stars in those bins is given by the color bar, with a contribution only from stars present throughout the whole period. The full temporal evolution over the last 1.4 Gyr of evolution is available as an online movie.
Current usage metrics show cumulative count of Article Views (full-text article views including HTML views, PDF and ePub downloads, according to the available data) and Abstracts Views on Vision4Press platform.
Data correspond to usage on the plateform after 2015. The current usage metrics is available 48-96 hours after online publication and is updated daily on week days.
Initial download of the metrics may take a while.