Fig. 6
Download original image
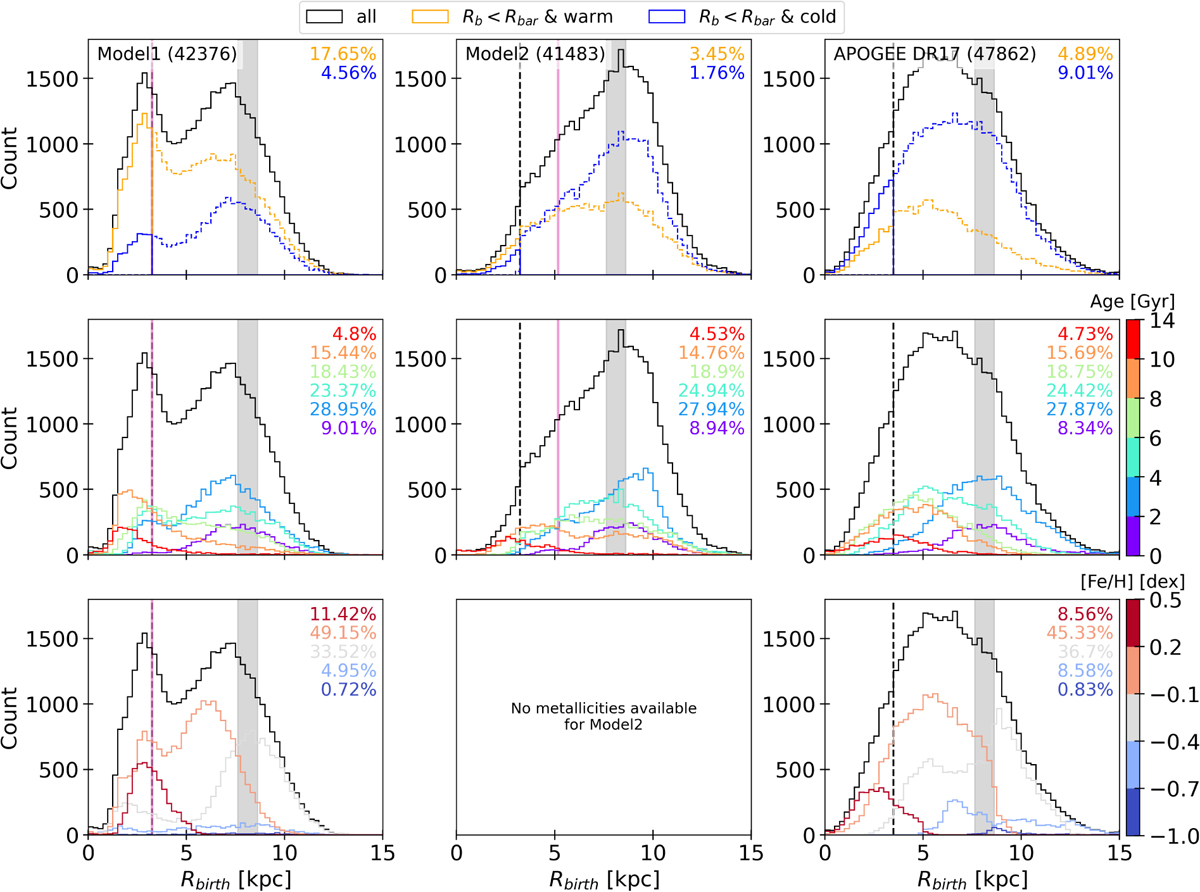
Birth radius distribution of stars found at the solar radius today (inside the gray vertical strip) of, from left to right, the two cosmological models Model1 and Model2, and the APOGEE DR17 red giant sample. The black curves are for the whole sample. In the top row, the blue and yellow curves highlight stars found today on orbits with e < 0.2 (cold) and 0.2 ≤ e < 0.5 (warm), respectively. The percentages that warm and cold stars born inside Rbar represent in the SNd are indicated in the top right of the panels for each galaxy. In the middle row, Rbirth distributions are shown for different monoage populations. From purple to red, stars get older and older, as indicated in the color bar. In the bottom row, Rbirth distributions are shown for different metallicity bins, blue and red representing metal-poor and metal-rich stars, respectively as indicated in the color bar.
Current usage metrics show cumulative count of Article Views (full-text article views including HTML views, PDF and ePub downloads, according to the available data) and Abstracts Views on Vision4Press platform.
Data correspond to usage on the plateform after 2015. The current usage metrics is available 48-96 hours after online publication and is updated daily on week days.
Initial download of the metrics may take a while.