Fig. 8
Download original image
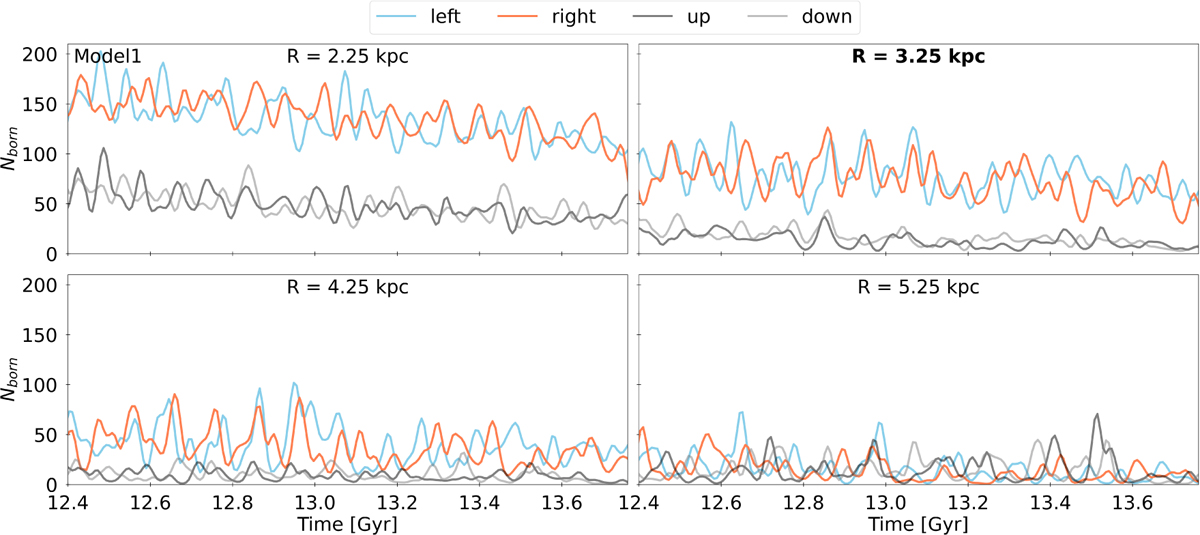
Modell star formation temporal evolution in 2 × 2 kpc2 square regions centered at increasing radii from left to right and top to bottom, spanning radii from 2.25 kpc to 5.25 kpc. The squares of the leading and trailing sides of the bar, shown in Fig. 1, are merged into one square per edge of the bar centered on (x, y) = (±R, 0), light blue and orange indicating the left and right side, respectively. The upper and lower edges of the bar minor axis are differentiated, using black and gray, respectively. The regions at the bar ends show i) lots of fluctuations, ii) more star formation than along the bar minor axis until just outside the bar radius.
Current usage metrics show cumulative count of Article Views (full-text article views including HTML views, PDF and ePub downloads, according to the available data) and Abstracts Views on Vision4Press platform.
Data correspond to usage on the plateform after 2015. The current usage metrics is available 48-96 hours after online publication and is updated daily on week days.
Initial download of the metrics may take a while.